CAM-chem is based off the offline MOZART Chemical Transport Model, which used meteorological reanalyses to explicitly describe the model dynamics and consequently used the reanalysis vertical layers. CAM-chem is an online chemistry-climate model, the atmospheric component of the Community Earth System Model (CESM) and thus has its own dynamical and physical schemes. The model dynamics can be nudge towards reanalysis products, that assimilates meteorological observations, for model experiments that require reproducing real-world events.
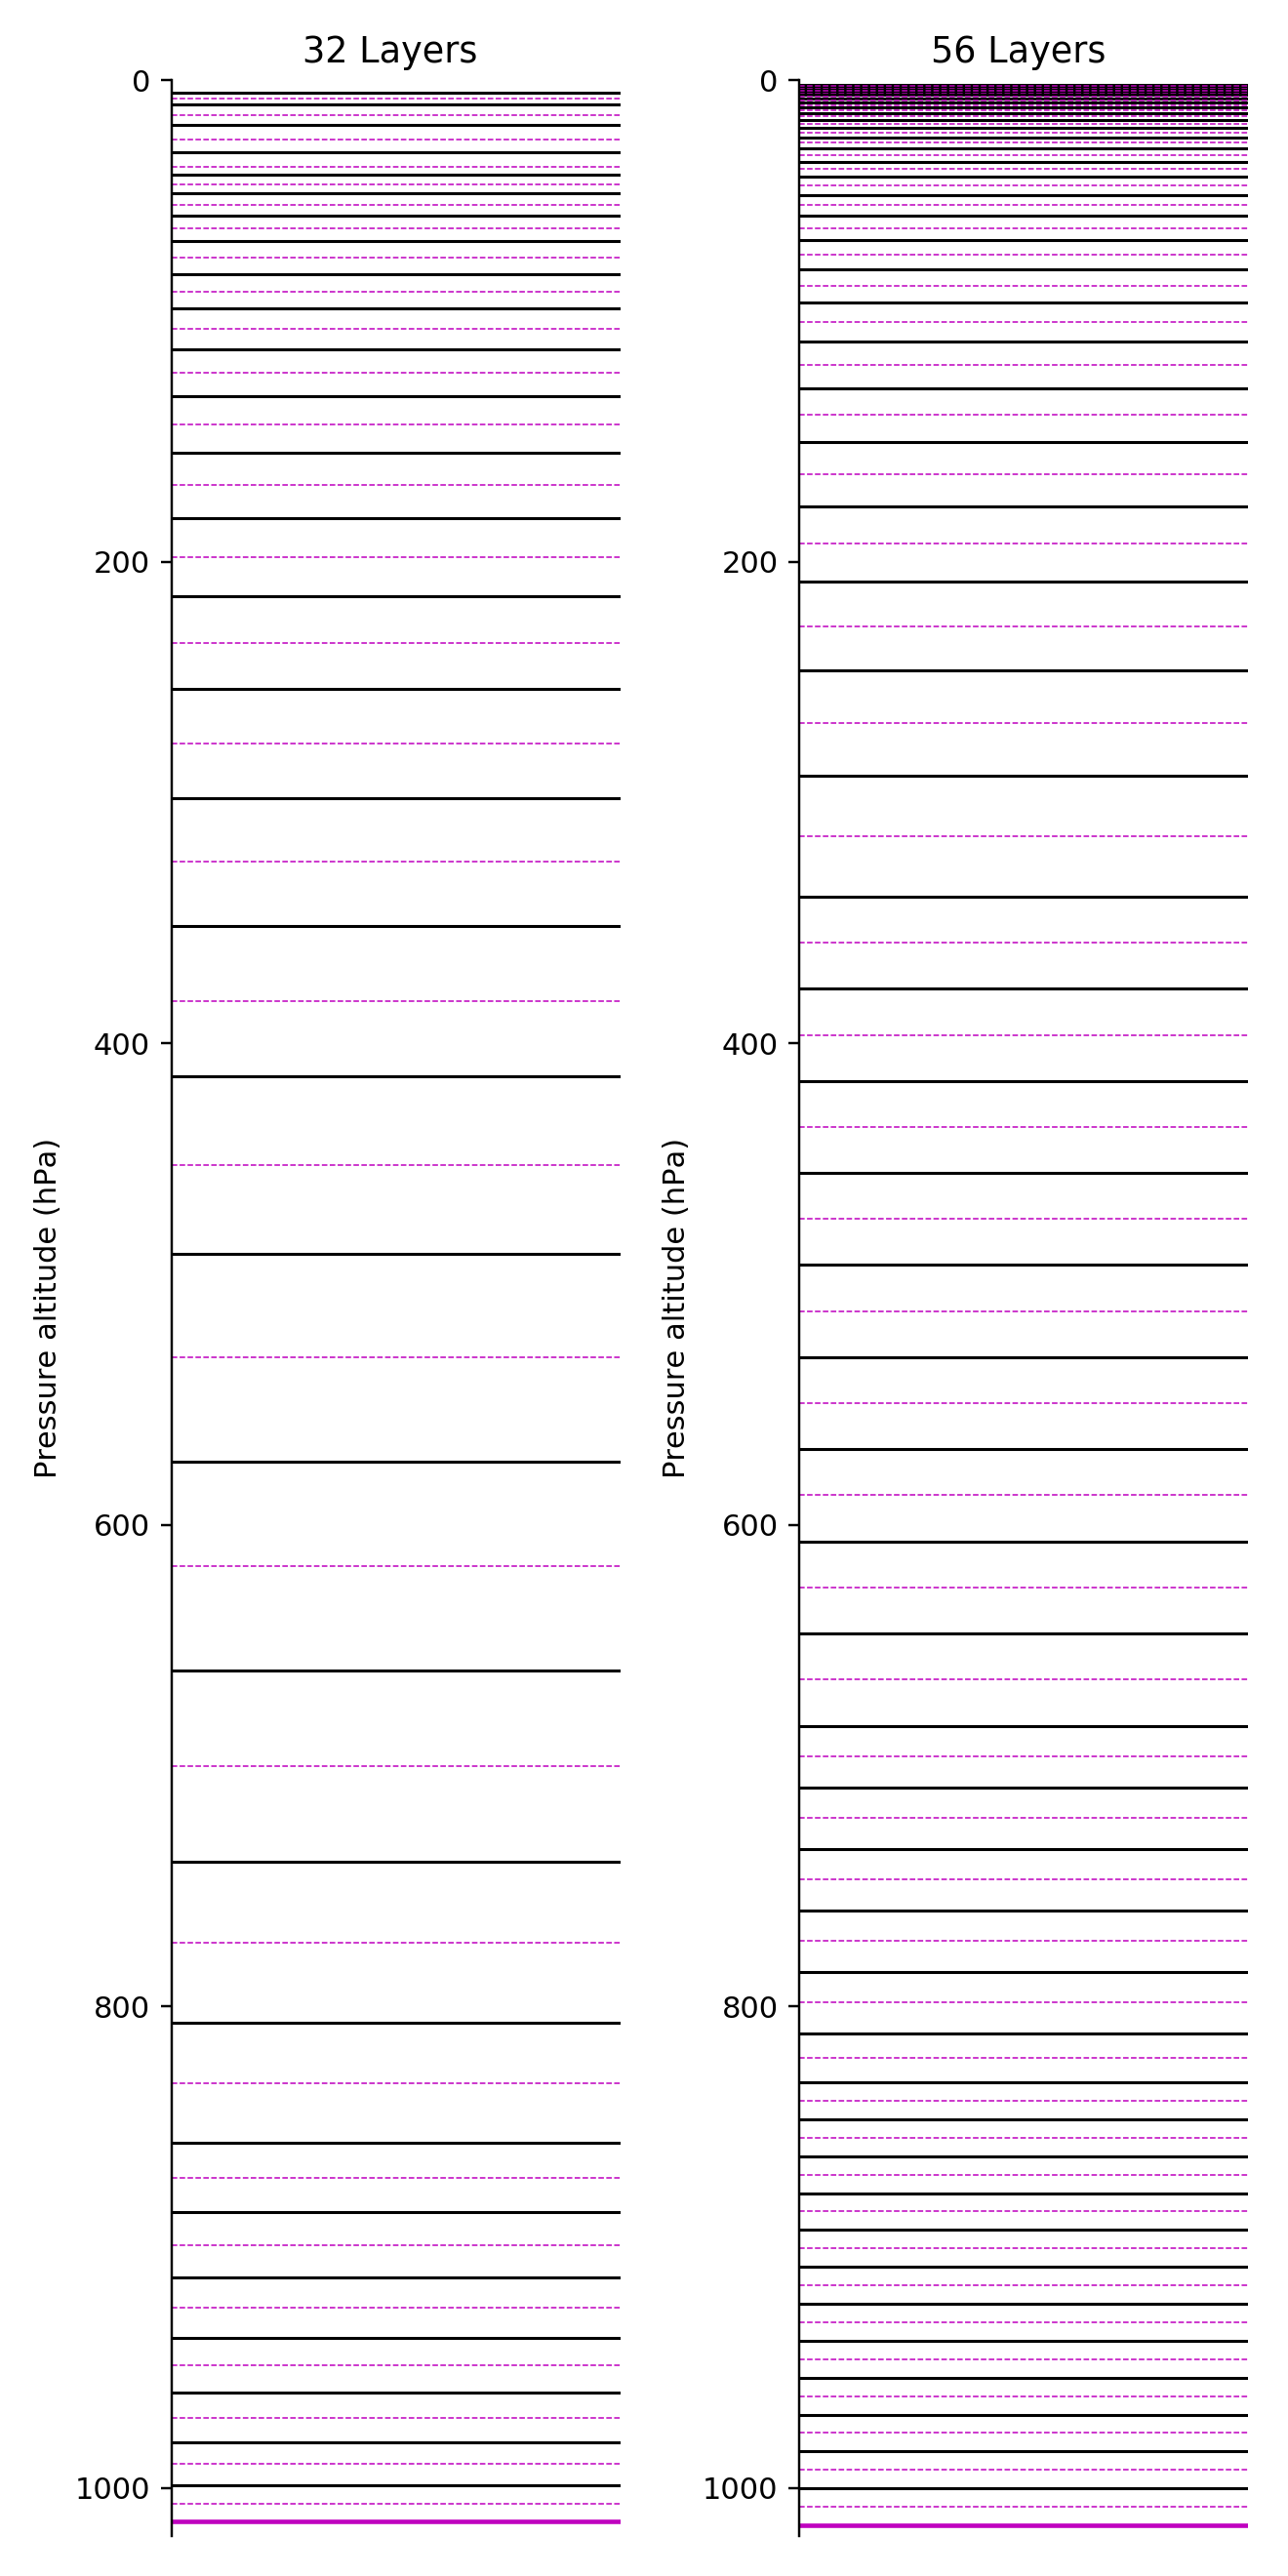 Figure 1: Typical sea level layer pressure's altitude grid or 32 Layers (left panel) and 56 Layers (right panels), the black lines show the layer interface and the purple dashed line the center of the layer [B. Gaubert].
The initial implementation in CAM-chem into CCSM used NCEP reanalysis (e.g. Hess and Zbinden, ACP, 2013). At that time, interpolation of the reanalysis fields to CAM-chem vertical levels resulted in excessive stratosphere-troposphere exchange, and better performance was found using the vertical levels of the reanalysis fields. However, updated components in CESM2, including CLUBB, improve the representation of clouds and are potentially more sensitive to differences between physics and dynamics model levels. By default, the Free Running CAM-Chem compset (FCHIST) has 32 layers and the Specified Dynamics compset (FCSD) has 56 layers (figure 1), and the latter is using the GEOS grid. Recently, we hypothesized that running a FCSD case with 32 instead of 56 layers could produce better results because the internal model physics is tuned to that layer structure. We performed an experiment to compare meteorological vertical levels of 32 and 56 layers, and found that there was little difference between resulting chemistry averaged over 2003-2012 (Table 1). However, we find differences in the modeled clouds, which are exacerbated regionally (Figure 1 and 2). We particularly see large differences over the Tibetan Plateau. This has the potential for a large effect on ozone, with larger regional differences.
| Global Average values 2003-2012 | 56L | 32L | 56L-32L |
|---|---|---|---|
CH4_LIFETIME (yr) | 7.478 | 7.631 | -0.153 |
CH3CCL3_LIFETIME (yr) | 4.478 | 4.582 | -0.103 |
CO_BURDEN (Tg) | 287.389 | 293.319 | -5.930 |
CO_EMIS (Tg/yr) | 1063.802 | 1063.172 | 0.630 |
CO_TDEP (Tg/yr) | 138.416 | 138.496 | -0.080 |
CO_CHEM_LOSS (Tg/yr) | 2348.777 | 2315.937 | 32.840 |
CO_LIFETIME (yr) | 0.116 | 0.120 | -0.004 |
O3_BURDEN (Tg) | 338.290 | 324.627 | 13.662 |
O3 Strat BURDEN (Tg/yr) | 2847.368 | 2817.248 | 30.120 |
O3_STE (Tg/yr) | 476.645 | 490.927 | -14.282 |
ISOP_EMIS (Tg/yr) | 464.215 | 460.233 | 3.981 |
LNO_PROD (TgN/yr) | 3.943 | 3.063 | -0.881 |
Total optical depth | 0.161 | 0.154 | -0.007 |
See all comparisons here: 2003-2012 comparisons
Table 1: Selected results from CAM-chem simulations with different vertical levels.
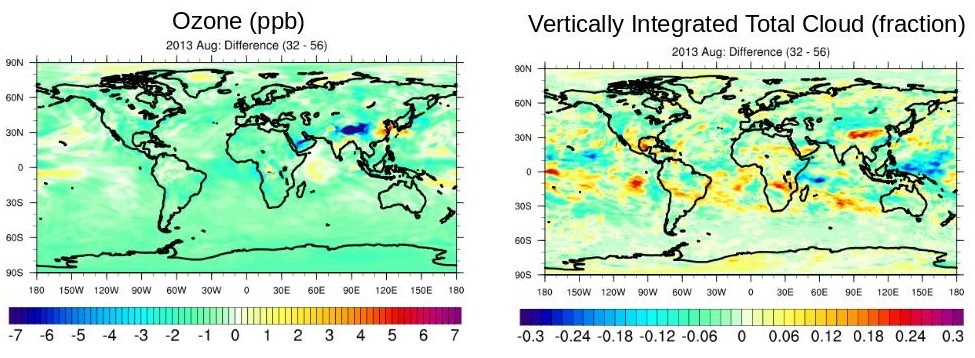
Figure 2: Cloud and ozone differences between 32 and 56 layer simulations for August, 2013 showing that regionally, large difference may occur [R. Schwantes].