APE CAM/HOMME Benchmark Results
Benchmark results with CAM 3.5 physics
- https://svn-ccsm-models.cgd.ucar.edu/cam1/branches/homme_cam3_5_29
- Resolution:
- Physics dtime = 30min. Subcycled dynamics.
- NE=16 26 Levels (1.9 degree) dt=3min (1536 elements, 13826 columns)
- NE=21 26 Levels (1.43 degree) dt=2min (2646 elements, 24K columns) 252 points along equator (~T85)
- NE=30 26 Levels (1.00 degree) dt=1.5 min (5400 elements, 49K columns)
- NE=60 26 Levels (.50 degree) dt=45s (21600 elements, 194K columns)
- NE=120 26 Levels (.25 degree) dt=20s (86400 elements, 778K columns)
- Model was run for NCPU/3 days (about 10 min runs). SYPD taken from stdout, best out of two simulations.
- qneg3.F90: tolerence changed to 1e-3 to avoid QNEG3 messages to stdout.
- most I/O disabled
- namelists: drv_in atm_in
- Using standard CAM datasets, except for a symmetric ozone dataset (APE.o3_64x1_L59_c060929.nc) and two grid dependent datasets (created from EUL T85 datasets via interpic_new tool):
- AerosolMass_V_ne21np4_clim_c070730.nc
- cami_0000-01-01_ne21np4_L26_ape_c071210.nc
- All datasets are now installed at NCAR (but namelists above need to be updated for NCAR names/locations)
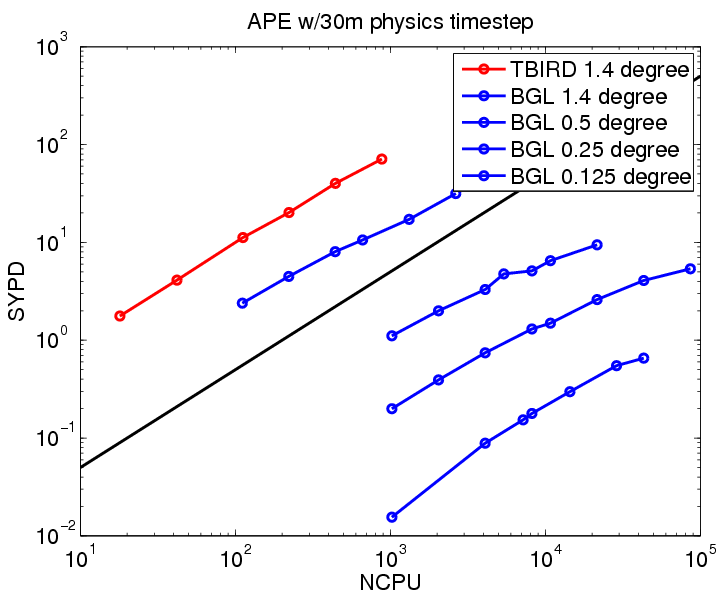
Results from LLNL IBM BG/L
Each curve shows the fixed mesh scalability
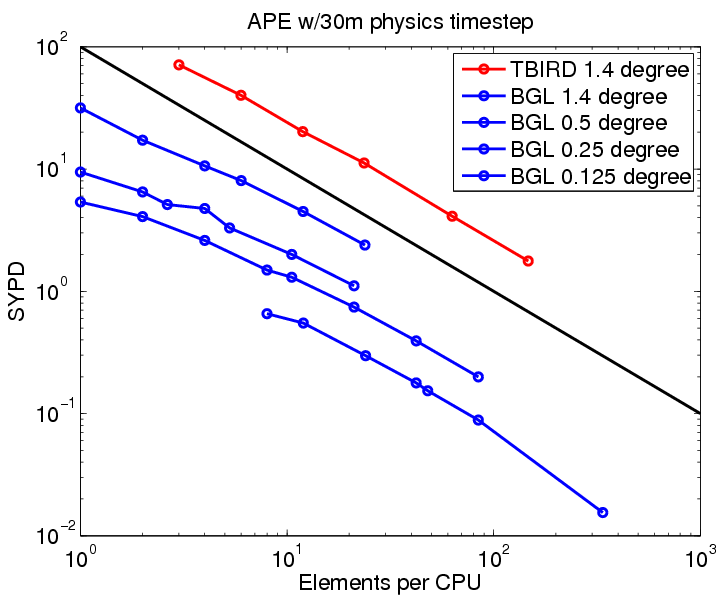
This is the same data as plotted above, except the x-axis is changed to elements per processor, to show that each resolution has good scalability down to 1 element per processor.
Results from Sandia/Thunderbird
Linux cluster, 4480 nodes, dual 3.6 GHz Intel EM64T processors. These results are from the older homme_cam3_5_23 branch.
1.9 degree NE=16 1536 elements |
||
NCPU |
Elem/CPU |
SYPD |
24 |
64 |
4.53 |
48 |
32 |
9.45 |
96 |
16 |
20.0 |
192 |
8 |
38.3 |
384 |
4 |
70.6 |
768 |
2 |
118 |
1.4 degree NE=21 2646 elements |
||
NCPU |
Elem/CPU |
SYPD |
18 |
147 |
1.77 |
42 |
63 |
4.11 |
112 |
24 |
11.2 |
222 |
12 |
20.2 |
442 |
6 |
40.1 |
882 |
3 |
71.1 |