Wheeler-Kiladis Wavenumber-Frequency Plots
All plots courtesy of Dave Williamson.
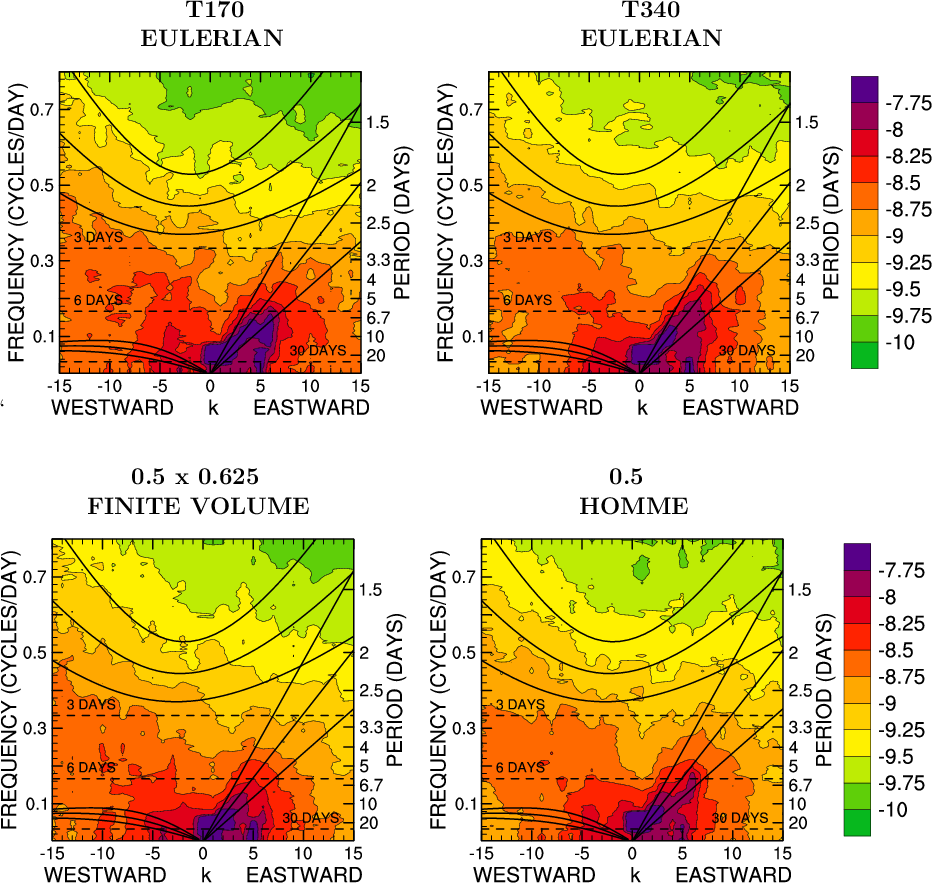
These plots show the symmetric component of the unnormalized power spectra of the precipitation averaged from 10 degrees S to 10 degrees N.
The black curves show the gravity waves (upper half of the figures), Kelvin modes (lower right) and Rossby waves (lower left).
For more details and lower resolution results, see Williamson, "Equivalent Finite Volume and Spectral Transform Horizontal Resolutions Established for Aqua-planet Simulations", Tellus, under review 2007,
and Wheeler and Kiladis, "Convectively Coupled Equatorial Waves: Analysis of Clouds and Temperature in the Wavenumber-frequency Domain", JAS 1999.