10/9, twh
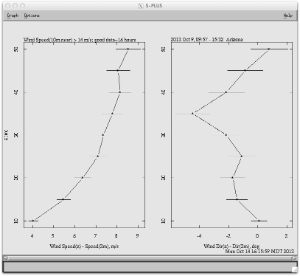
The high winds today provide an opportunity to adjust the wind directions on the profiles towers. We only measured the 3m sonic azimuth with the DataScope and assumed that the other sonics on the profile towers were aligned with the lowest level. For the past 6 hours, the wind speed above 3m at near has been higher than 15 m/s, while that at 3m has been 13-14 m/s. The following table shows the median wind directions relative to that at the lowest level. These values should be subtracted from the azimuth at each level.
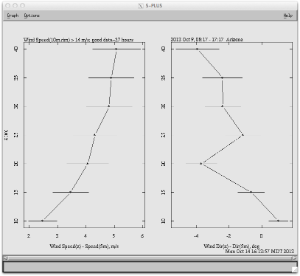
This adjustment is perhaps more tenuous at RIM because of the complex topography, but the speed and direction plots suggest little terrain influence for winds from 200 degrees (SSW).
See accompanying plots, made with dir.diff.profile for the exact period selected for high wind speeds.
10/31: I redid the analysis with a miminum wind speed of 10 m/s at 10 m. This gives a much larger data sample (105 hours at NEAR and 150 hours at RIM) and a wider range of wind directions, 190 - 230 deg at NEAR and 178 - 242 deg at RIM, with mean wind directions for both sites near 208 deg.
z(m) |
NEAR dir(z) - dir(3m) |
RIM dir(z) - dir(5m) |
|---|---|---|
10 |
0.1 - 0.37 = -0.3 |
1.0 + 0.87 = 1.9 |
15 |
-1.4 - 0.21 = -1.6 |
-0.7 + 1.07 = 0.4 |
20 |
-1.7 + 0.01 = -1.7 |
-3.7 + 1.56 = -2.1 |
25 |
-1.1 - 0.32 = -1.4 |
-1.2 + 2.21 = 1.0 |
30 |
-2.2 - 0.50 = -2.7 |
-2.4 + 2.3 = -0.1 |
35 |
-4.5 - 0.57 = -5.1 |
-2.4 +2.8 = 0.4 |
40 |
-2.1 - 0.947 = -3.0 |
-3.9 + 3.0 = -0.9 |
45 |
-0.9 - 0.58 = -1.5 |
|
50 |
0.8 - 1.11 = -0.3 |
|
Wind speed and direction at NEAR
10/31:

Wind speed and direction at RIM
10/31:
