Unknown macro: {div}
Support Takeoff and Landing with Runway Winds Information
Types of information that would support takeoff and landing:
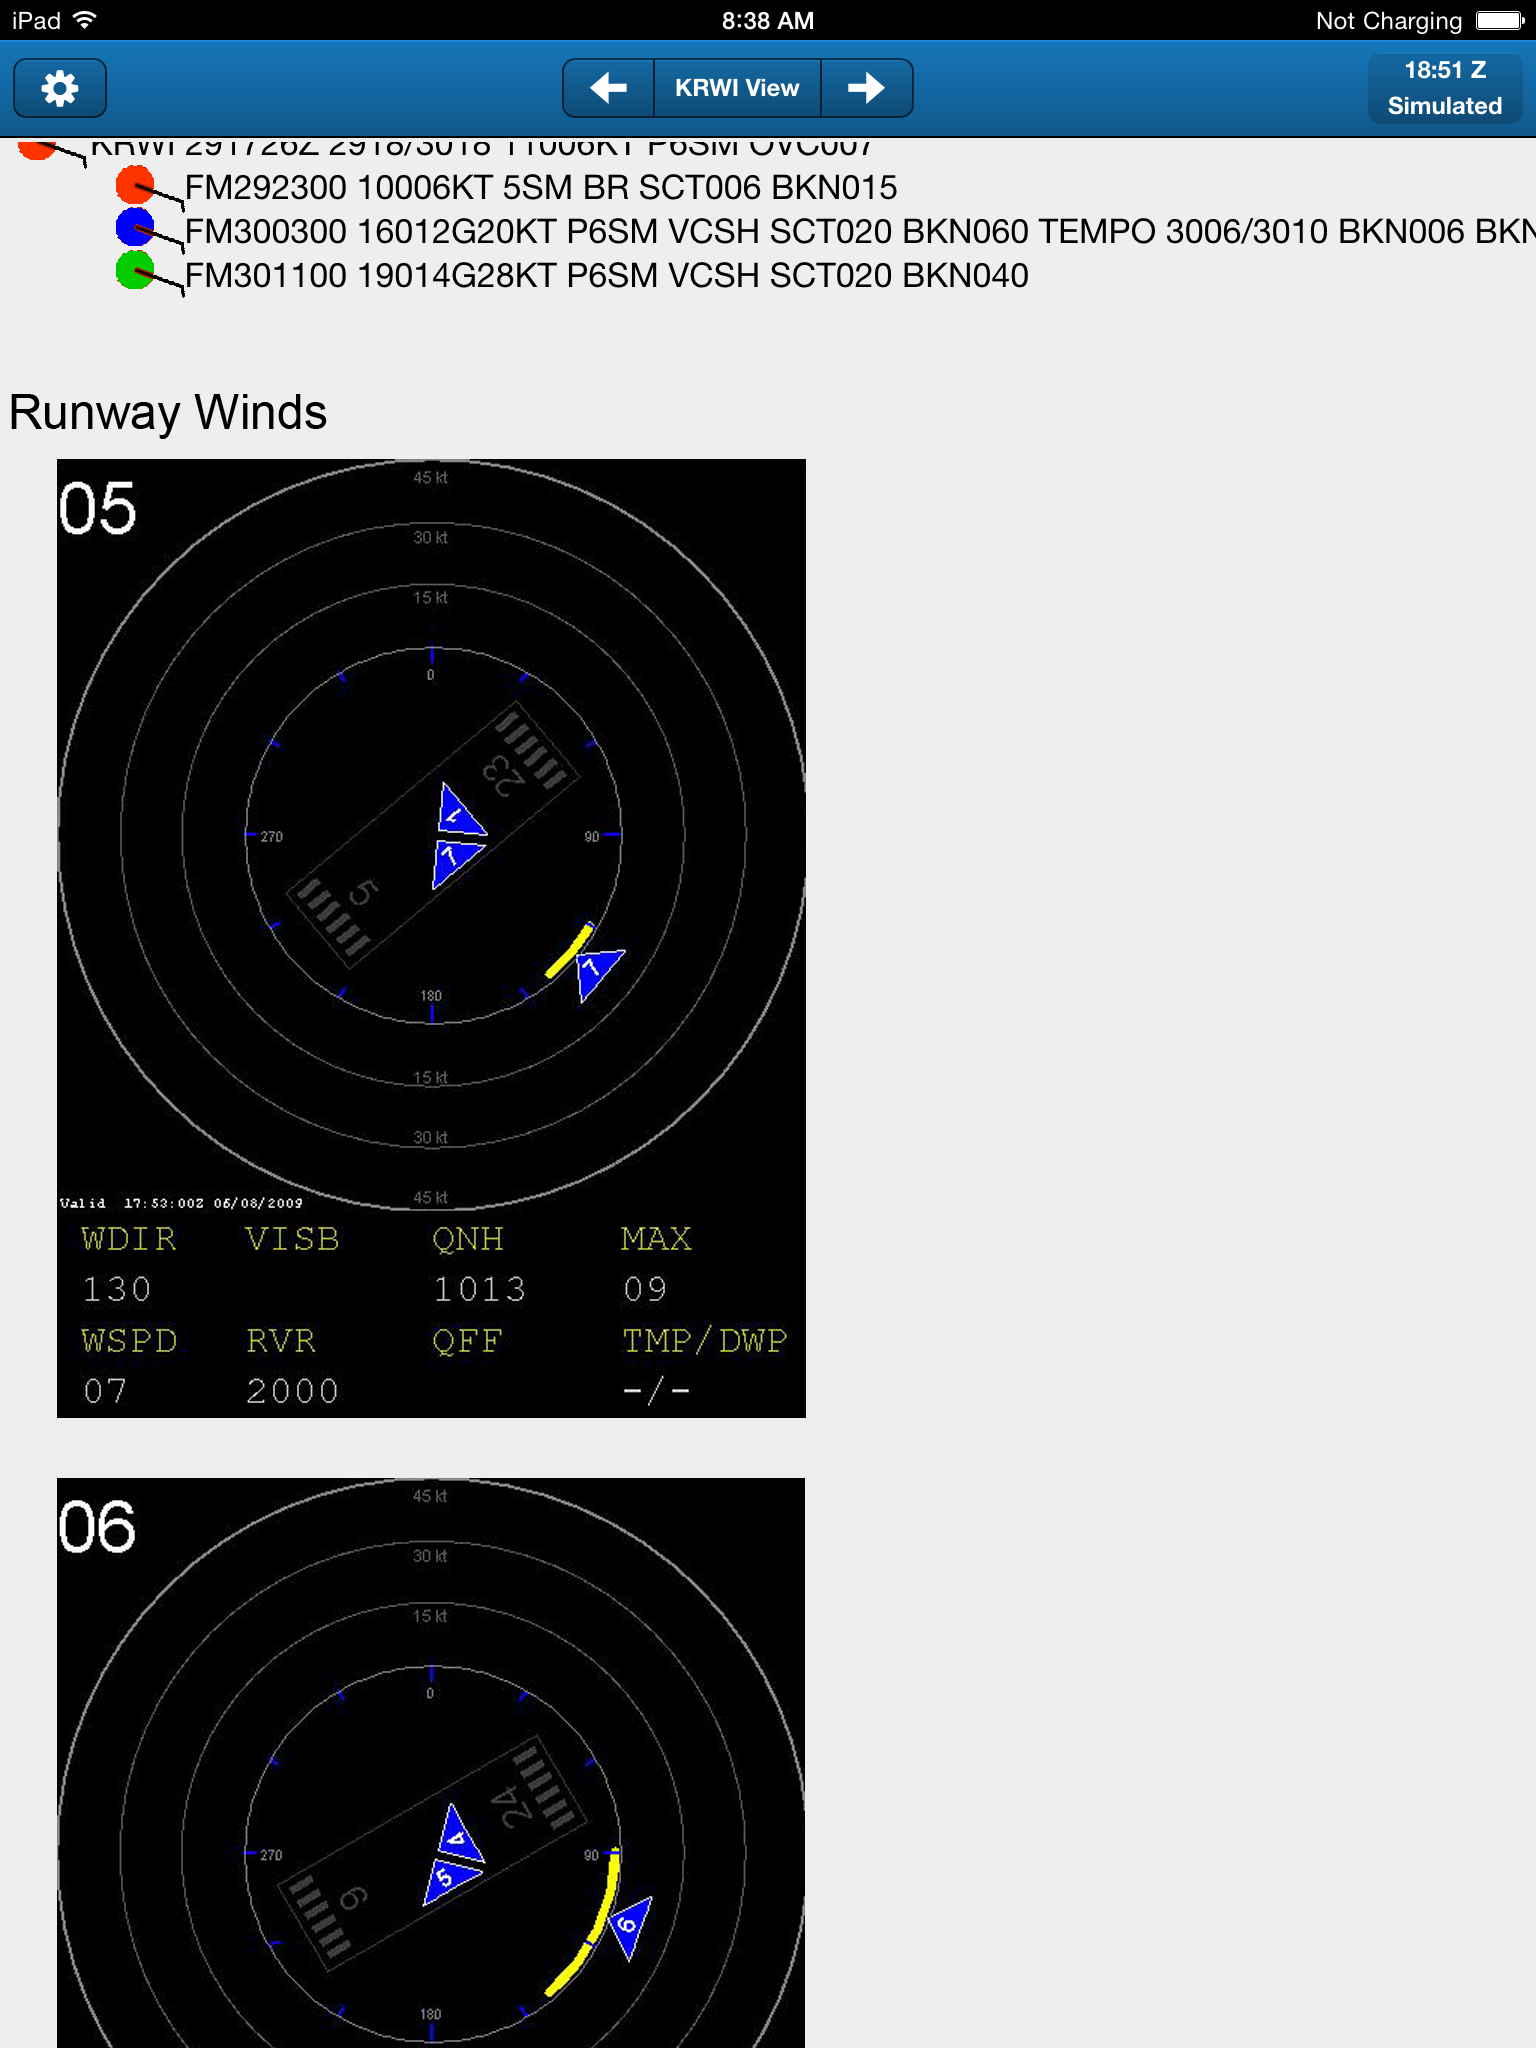
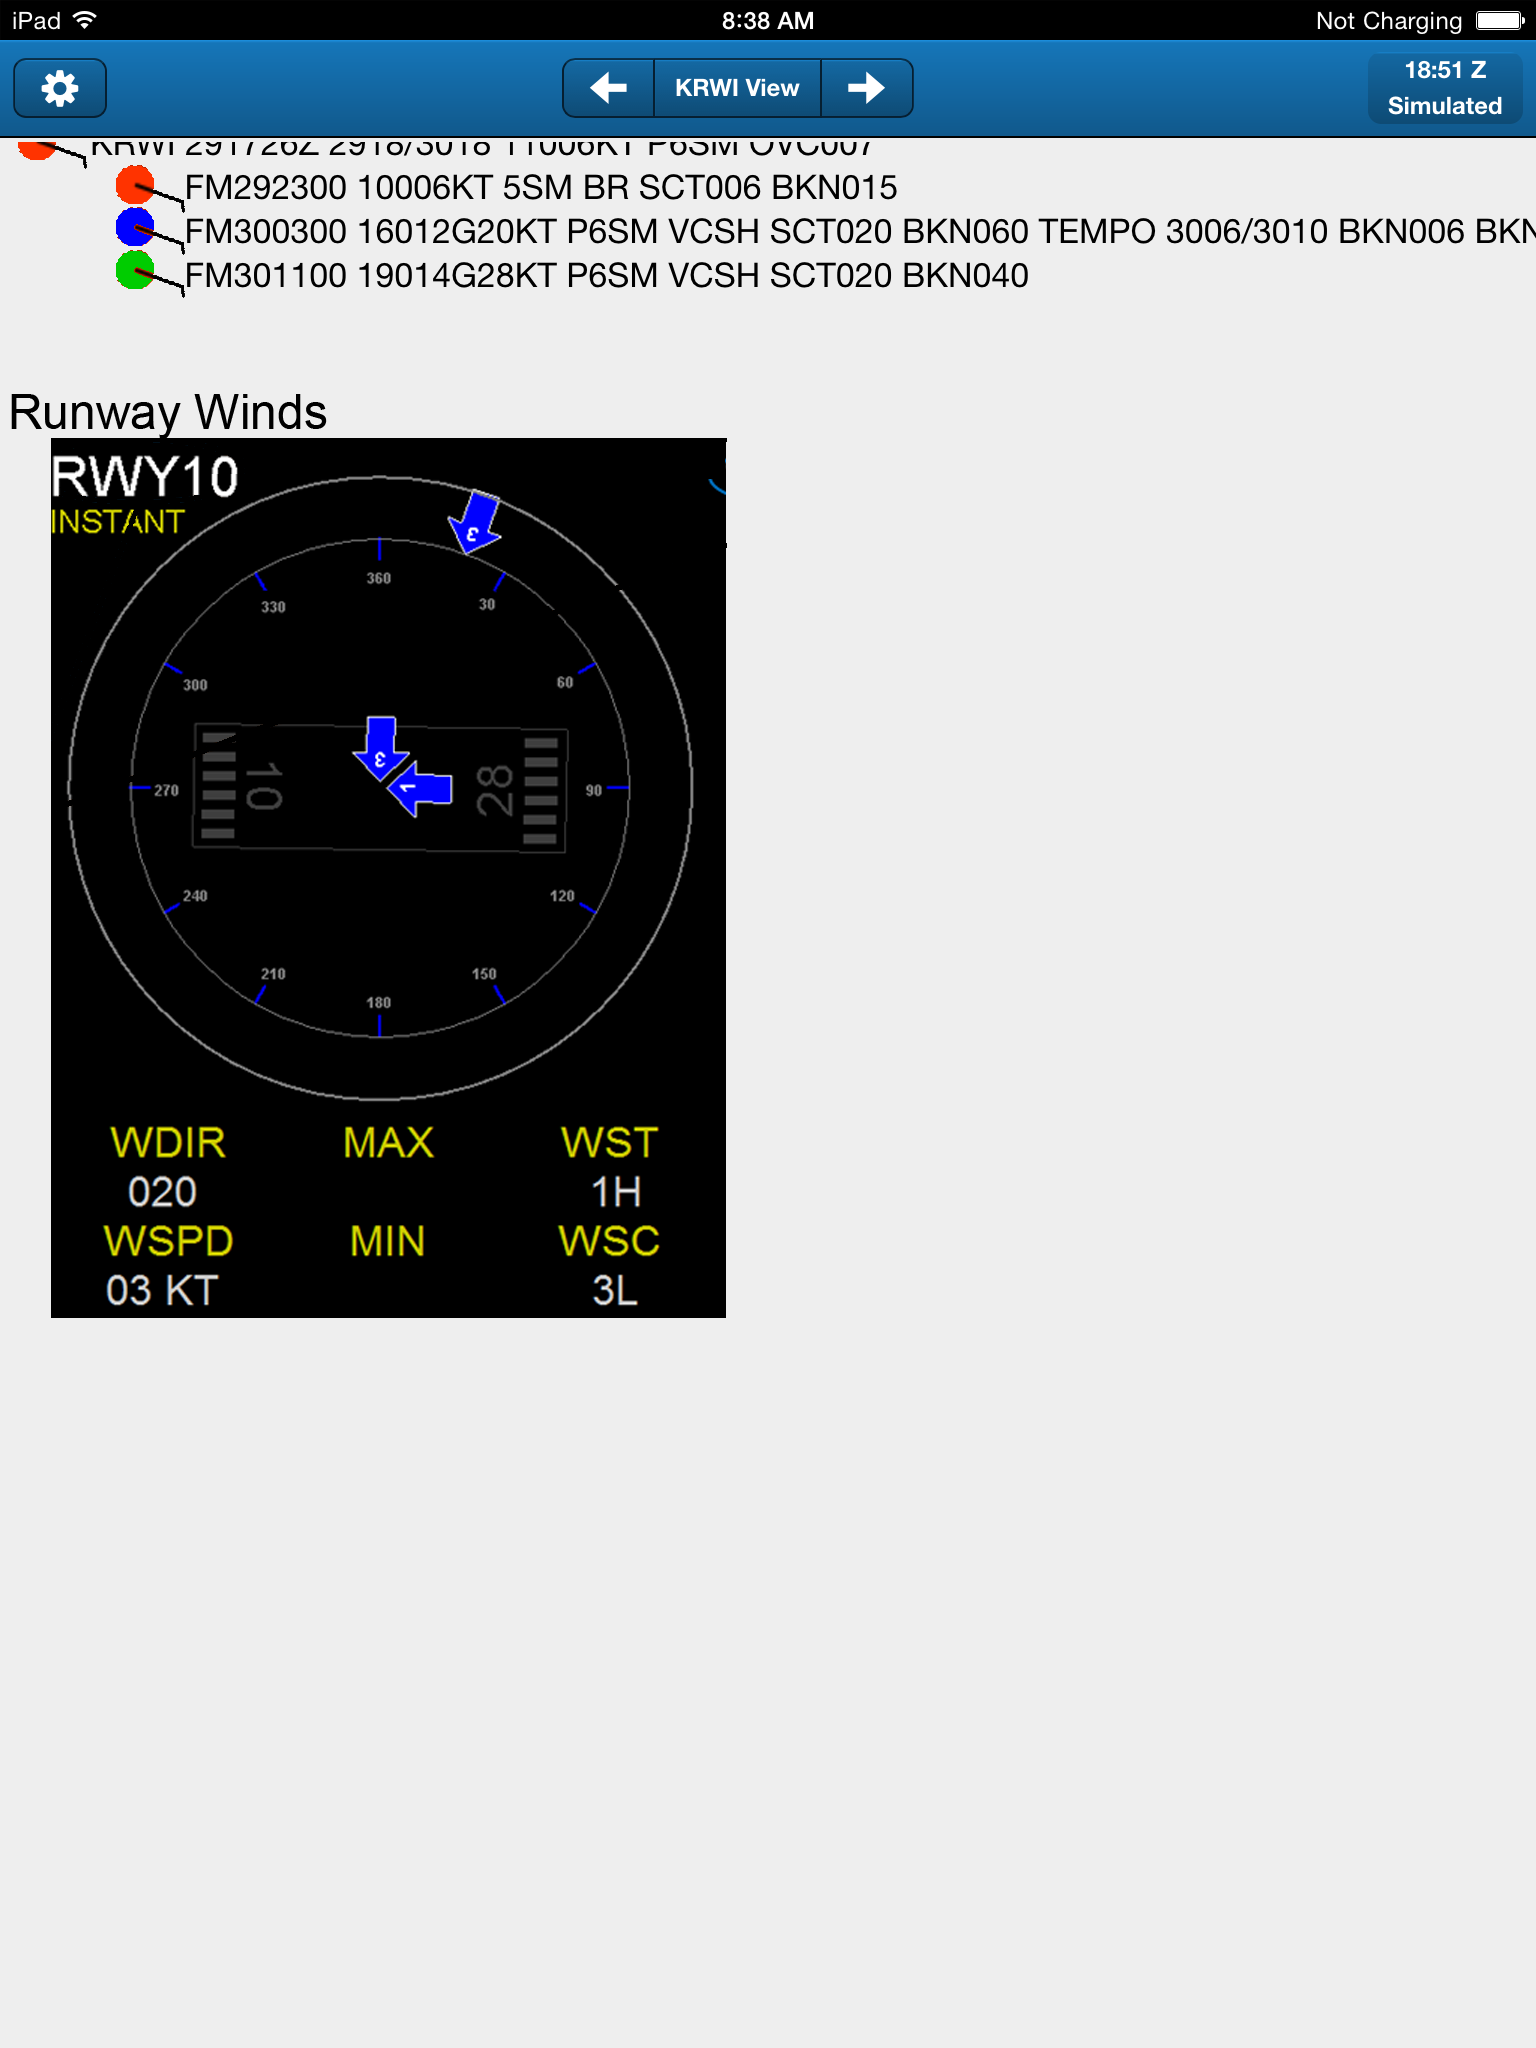
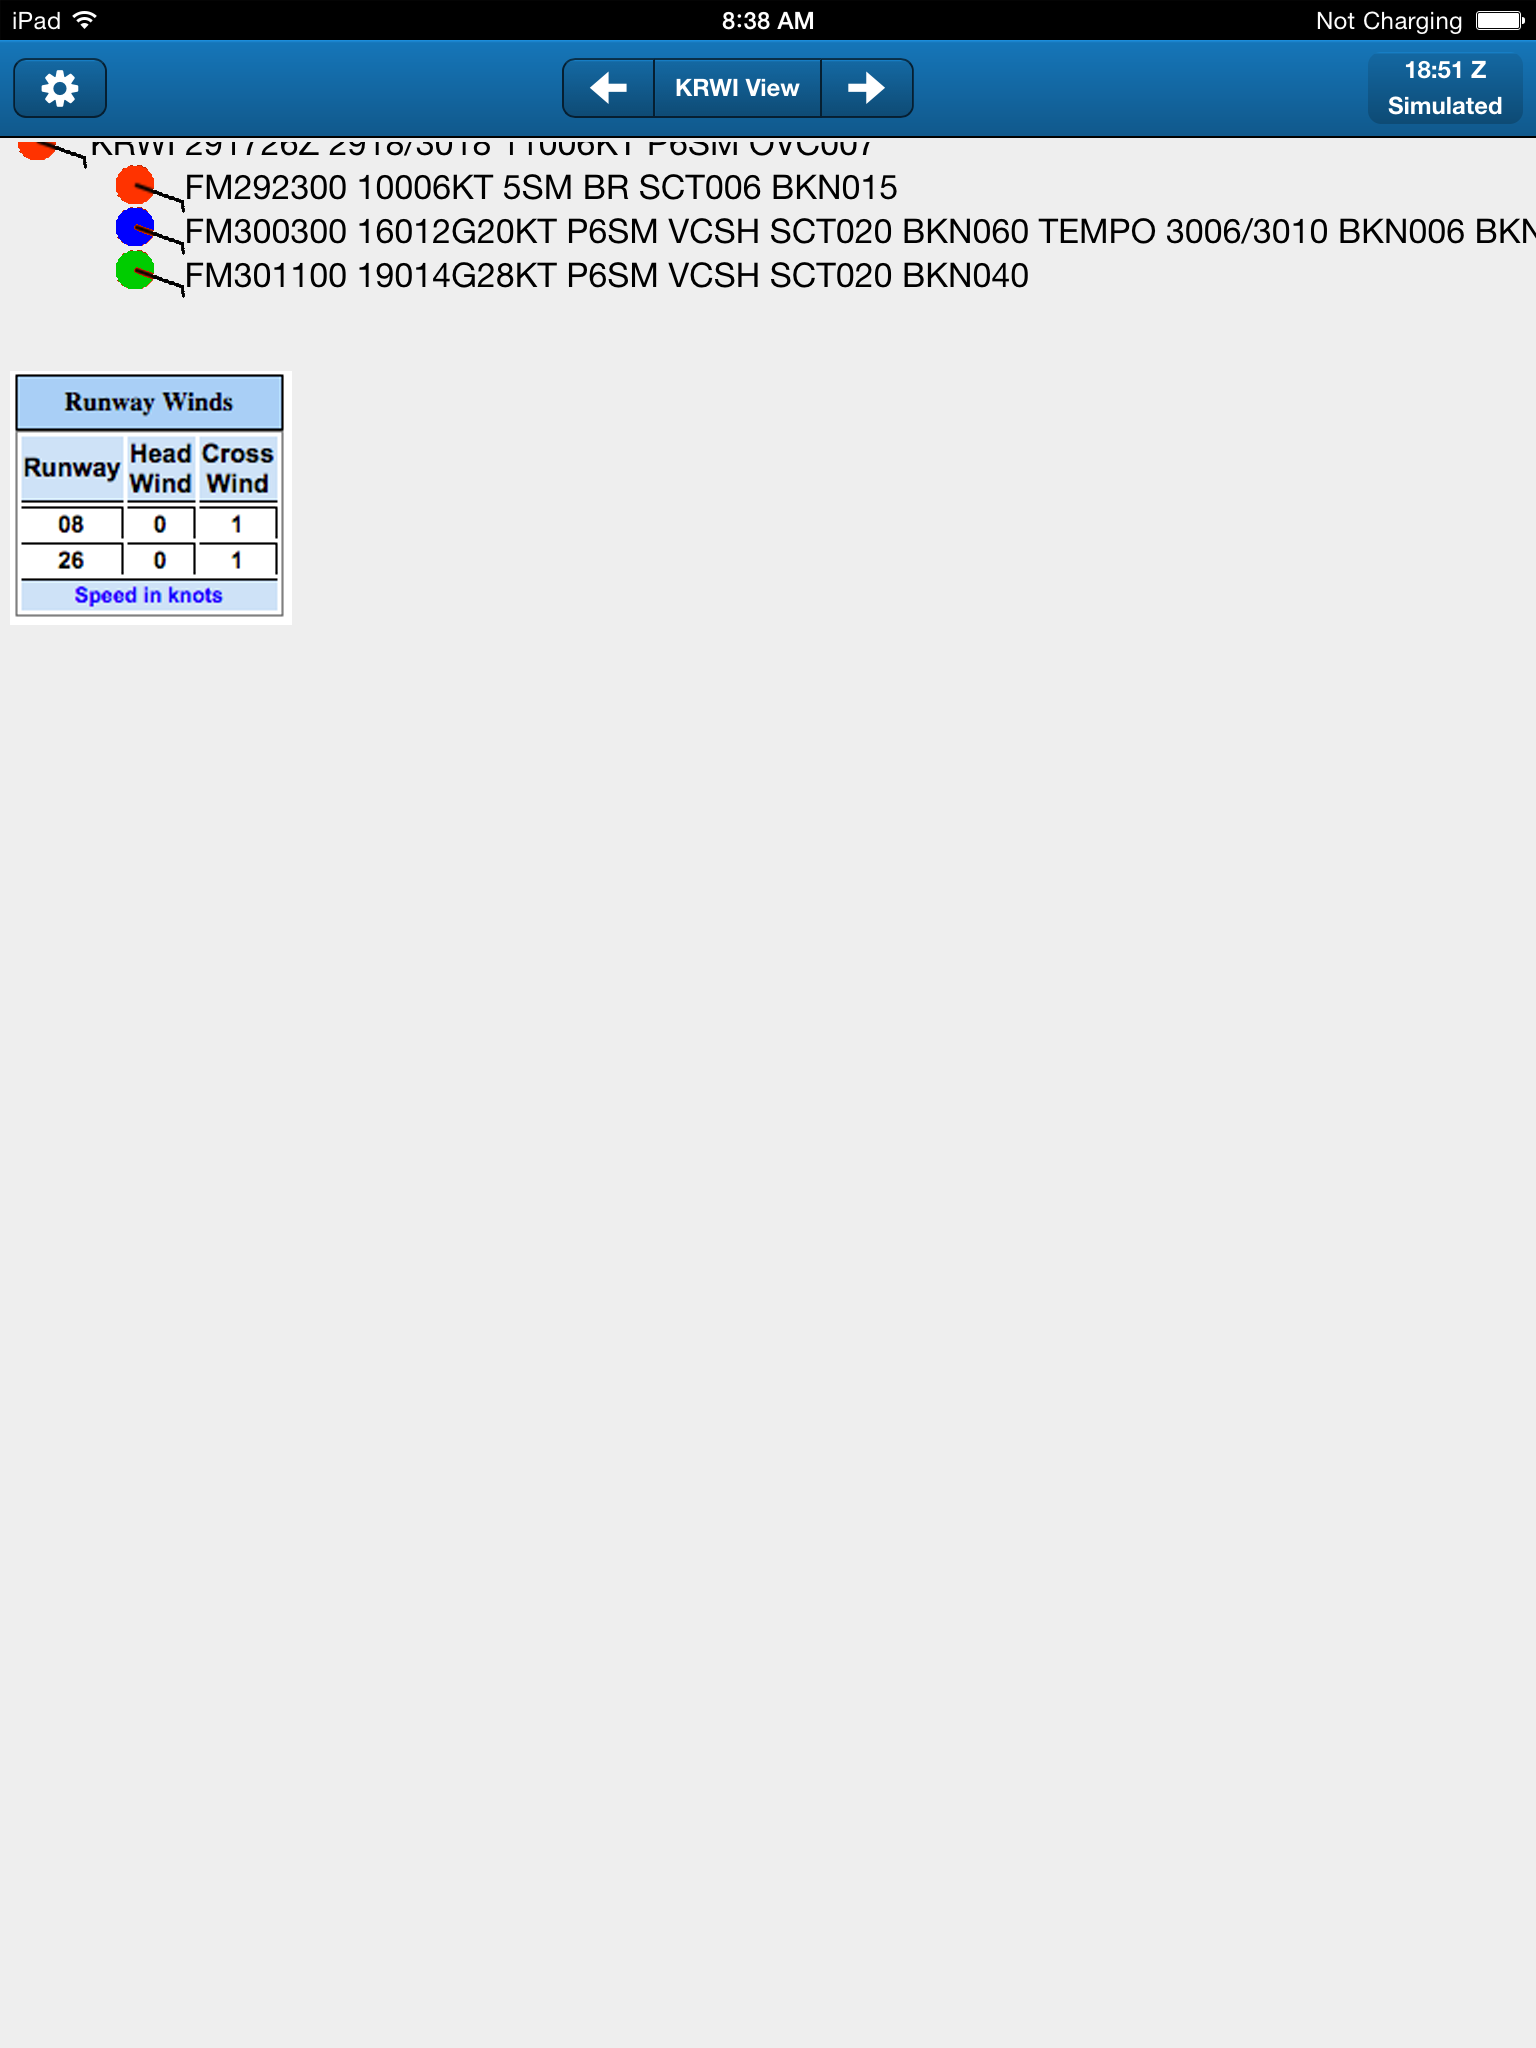
- Winds plotted on runway diagrams with vectors resolved onto runway axes (values show head/tail and xwinds)
- Wind min/max over historical period
- Wind variability over historical period
- Are these meaningful without the 1-minute data?
- Any customizations to the map to provide runway winds info?
- Surface high crosswinds or high variability via the map station symbol?
- Map inset could show runway winds.
- On map itself – "show winds at airport" (meaningful only if the pilot is able to specify the intended runway)
Runway-Relative Wind Diagrams
Wind Min/Max/Variability Over Historical Period
- Taiwan AOAWS uses 2-minute history
- What historical period would we use?
- Should we identify this as a technology gap and do this with a mockup? In the MobileMet app display or with printouts?
Data Freshness ( and Comm Status? )
- Comm Down: Map will go funky if unable to contact WMS, so it's not currently possible to show something pretty without an internet connection
- Map background will go pink where new tiles are needed
- Attempts to reload the grid will result in undefined behavior.
- Features also clear out on reload, and app won't be able to load new ones.
- Do we want to assume a good comm connection is necessary for this app? Or continue to research this aspect?
- Should we mark the whole app with a 'data stale' indicator, or individual pieces of data?
- We can easily track when we were last able to retrieve Wx data from the server
- How would we mark individual data items as 'Stale'?
- New 'Boxed' METAR rendering on the map could easily get a 'Red X' or similar treatment
- Could also mark METAR/TAF symbols and text throughout the app with an outdated marker.
- What comprises 'Stale' data?
- Can we pick a number of minutes for each feature type? Grid?
- Do these need to be configured on a per-pilot basis?
Implementation Questions
- Where do we obtain current runway listing and runway strike?
- How do we compute/deliver up-to-date runway winds? New service?
Check-in Regarding Meeting on the 19th
- Paddy needs help with the 'Phase of Flight Wizard' view
- Part of 'landing wizard could be to choose and/or indicate a planned runway and direction.
- Enter in the intended runway/direction
- Look at runway winds and choose a runway/direction
- The display is then further customized for that phase of flight based on the input
- On the map, show current runway winds with/instead-of the current METAR symbol
- Part of 'landing wizard could be to choose and/or indicate a planned runway and direction.
- Are we planning to meet with Bruce about... ?
- Are we confirmed for the 19th?
Notes from the Discussion
- Bob doesn't find the graphical depiction of runway winds very useful. Tabular fine. In GA world there are probably 2 pcs of pavement maximum.
- Would prefer table with a time series of speeds and a time series of directions
- 50-miles out deciding which runway to use. Choose a runway, then based on that choice, are headwind, crosswinds acceptable there?
- Arnaud: Once decision is made, not so interested in trends. Care about current conditions.
- Bob: May want both. But not looking at any other airports at that point.
- Wind sock or hour-old METAR?
- BDR has 15-min winds at NWS site. 1 min obs not available anywhere. This is a non-fed station. Can get it from UNIDATA's LDM.
- We could use the 15-min data for an eval. That would provide pilots with some idea of variability.
- Arnaud says we have access to the runway data for airports.
- **** 15-min obs at NWS – Bob sees these posted on the web site. Not sure which database. ASOS create a new observation every minute.
- MAIDIS.noaa.gov - metar, high-freq metar, mesonet, etc. There is an integrated data file there that's probably worth looking at. Also ncdc ftp site has 1-min data.
- Let's not make this a Trojan horse to get into the non-Fed sfc obs stations data. We just need the more-frequent winds, but there is a danger we could get sidetracked ingesting the suite of MAIDIS data. If we do that, we want to be clear.
- Bob: I don't think we can do much with a takeoff/landing winds advisor with hourly data.
- Lots of discussion about current winds in table with multiple traces to show historical winds
- Could also try to identify preferred runway as maximum headwind.
- What info pilots have, and how they know what runway they are lining up on:
- Pilots know from their AIDIS they listen to on their radios (airports with towers) – which runway is active.
- Not available digitally in any way, as far as Bob knows.
- Data freshness / comm status – Arnaud thinks that comm is irrelevant to the user. All user wants to know is if we have the freshest data
- Juneau used two-threshold indicator: Yellow but show data, and Red and hide data.
- Don't get rid of comm status completely, but it's an overarching piece of info.
- Counterargument: specis or pireps.
- Data Freshness: this is all so undetermined it may not make sense to try to mock something up.
- First question: what different techniques allow them to know something. "we intuitively know that it's important to let the pilot know, but what are the best ways to do this?"
- There are cases where pilots have made incorrect decisions based on old data. There are case studies. If they knew the data was old, would that have helped them make a better decision? But first, need to figure out how we would show that to the pilot.
- Bob: having discussed this, leans towards making this a cognitive eval. Some things more efficiently done as 'tabletop evaluation' --> show some things not nec. related to the simulation. Give them some options and let them choose what to code up for actual eval in the simulator. Possible to do this with a focused group of experts. But not done just by the researchers.
- Todo:
- Modify the table view of runway winds to show runway-relative readings, peaks, and direction as time series traces.
- Modify the graphical views to make sure they show the min/max winds over the 2-min avg period, and a historical wind trace for the airport (magnetic winds).
- Surface selected runway winds onto map or inset.
- Might be value in showing trending the way that JAWS does. History of winds on those runways might be useful
- Find a way to describe the questions related to runway winds:
- Wind trends represented
- Current winds represented
- Specificity of the data to its end use vs. conserving space and not overwhelming the pilot with many plots that all show similar data
Overview
Content Tools
For help with this wiki, please contact Arnaud Dumont at the National Center for Atmospheric Research
Unknown macro: {copyright}
2012 UCAR![]() .
.