Synoptic Conditions
Nevada was in a slight upper level deformation zone with a weak high to the north and a low to the south. Closer to the surface, the area was mostly influenced by the high and some cold air advection at 850 mb. At the surface, this manifested as slight areas of deformation present in the pressure field slowly giving way to an approaching cold front in California. There was also troughing at the surface ahead of this front. Soundings showed extremely dry conditions throughout the atmosphere.
Clouds/Precipitation
There was no apparent precipitation in the area ahead of the front. There was also little indication of any clouds on the first two days of the period. However, moving into 0000 UTC on 11 March a line of clouds moved across the area ahead of the approaching cold front. Clouds continued to develop and move across the Las Vegas area behind the initial line of clouds, producing transient cloudiness through about 1430 UTC. A second round of clouds entered the area at approximately 1915 UTC and out again by 2145 UTC. Conditions remained clear until about 0000 UTC March 12. Widespread cloudiness persisted in the area the entire next day.
Maps/Images
250 mb contour plot at 1200 UTC, 10 March 2012, showing deformation

850 mb contour plot at 1200 UTC, 9 March 2012, showing high pressure aloft

850 mb contour plot at 0000 UTC, 11 March, showing approaching system with CAA aloft

Surface analysis at 0600 UTC, 10 March, showing deformation in pressure field

Surface analysis at 1800 UTC, 11 March, showing prefrontal troughing and approaching front

VIS satellite at 0000 UTC, 11 March 2012, showing approaching cloud line ahead of front

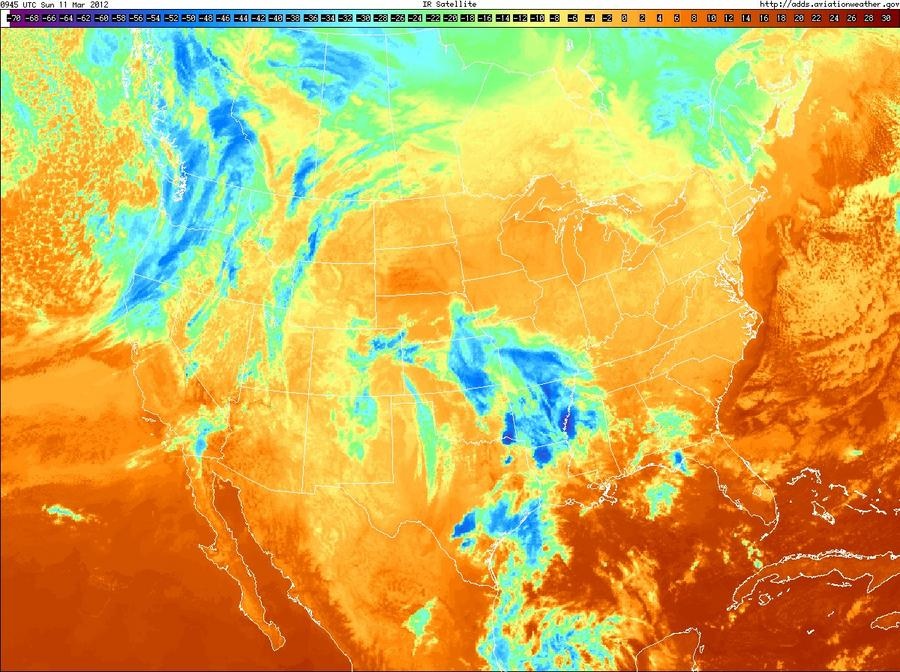
IR satellite at 1010 UTC, 11 March 2012, showing cloudiness near Las Vegas
VIS satellite at 2030 UTC, 11 March 2012, showing thin clouds near Las Vegas

VIS satellite at 0000 UTC, 12 March 2012, showing cloudiness filling in at end of period as front approaches
