On Saturday 2008-10-25, 3 strong but relatively shallow supercells developed in the Brisbane region and moved northwards parallel to the coast.
There was some discussion amongst the meteorologists about this event.
The forecast for Brisbane was for some showers, but it seems that the severity of the storms was not really expected. The instability was related to some cooling in the mid levels, which was stronger than predicted.
Of the storms which occurred on that day, three were particularly strong:
- Case 1: started Gold Coast, 1040 local, ended Stradbroke Is, 1420 local
- Case 2: started Beenleigh, 1300 local, ended Caloundra, 1640 local
- Case 3: stared N Brisbane, 1500 local, ended west of Noosa, 1820 local
None were particularly tall, reaching about 10 km max. They did have rotation in them, and all moved almost due north along the coast.
The following TITAN summary image shows all of the storms for the day, depicted as ellipses:

The reflectivity time-height plot for case 1 summarizes the reflectivity history of the storm.
The figures show the value and height of the maximum reflectivity at each time:

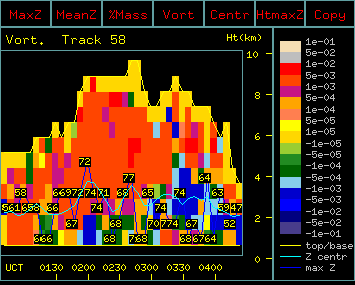
The vorticity time-height plot for case 1 shows the rotation of the storm around the
centroid. Note the contiguous red region which indicates rotation typical of a left-moving
supercell in the Southern hemisphere:
The following plot is a plan view of case 2 at 1420 UTC, showing the lightning activity (yellow crosses)
and TITAN forecasts of storm motion:

The CP2 radar was run in RHI mode to investigate the vertical structure.
RHI section of radar reflectivity:

The reflectivity was rather strong for a storm of this depth, reaching values in above 65 dBZ.
RHI of radial velocity:

RHI of Particle ID:

The PID vertical section shows what is interpreted as a hail core (yellow).
By early afternoon the situation was quite stable and the storm activity had moved off well to the north.