...
See accompanying plots, made with dir.diff.profilejjjj for the exact period selected for high wind speeds.
10/31: I redid the analysis with a miminum wind speed of 10 m/s at 10 m. This gives a larger data sample and a wider range of wind directions, 190 - 230 at NEAR
| Section |
|---|
| Column |
|---|
z(m) | NEAR dir(z) - dir(3m) | RIM dir(z) - dir(5m) |
|---|
10 | 0.1 | 1.0 | 15 | -1.4 | -0.7 | 20 | -1.7 | -3.7 | 25 | -1.1 | -1.2 | 30 | -2.2 | -2.4 | 35 | -4.5 | -2.4 | 40 | -2.1 | -3.9 | 45 | -0.9 | | 50 | 0.8 | |
|
| Column |
|---|
Wind speed and direction at NEAR 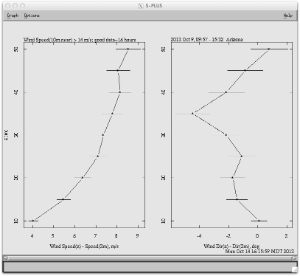
|
| Column |
|---|
Wind speed and direction at RIM 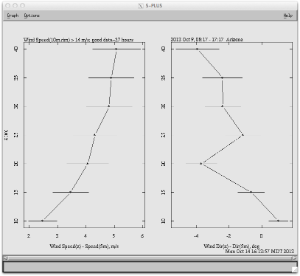
|
|