...
10/31: I redid the analysis with a miminum wind speed of 10 m/s at 10 m. This gives a much larger data sample (105 hours at NEAR and 150 hours at RIM) and a wider range of wind directions, 190 - 230 deg at NEAR and 178 - 242 deg at RIM, with mean wind directions for both sites near 208 deg.
| Section |
|---|
| Column |
|---|
z(m) | NEAR dir(z) - dir(3m) | RIM dir(z) - dir(5m) |
|---|
10 | 0.1 - 0.37 = -0.3
| 1.0 + 0.87 = 1.9
| 15 | -1.4 - 0.21 = -1.6
| -0.7 + 1.07 = 0.4
| 20 | -1.7 + 0.01 = -1.7
| -3.7 + 1.56 = -2.1
| 25 | -1.1 - 0.32 = -1.4
| -1.2 + 2.21 = 1.0
| 30 | -2.2 - 0.50 = -2.7
| -2.4 + 2.3 = -0.1
| 35 | -4.5 - 0.57 = -5.1
| -2.4 +2.8 = 0.4
| 40 | -2.1 - 0.947 = -3.0 | -3.9 + 3.0 = -0.9
| 45 | -0.9 - 0.58 = -1.5
| | 50 | 0.8 - 1.11 = -0.3 | |
|
| Column |
|---|
Wind speed and direction at NEAR 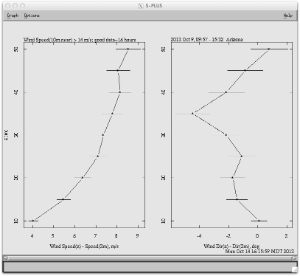
10/31: 
|
| Column |
|---|
Wind speed and direction at RIM 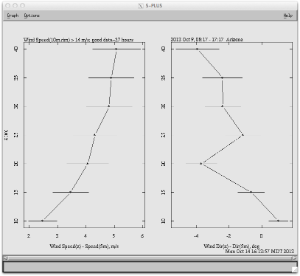
10/31:  |
|