The Atmosphere Model Working Group (AMWG) Diagnostics Framework (ADF) is an automated diagnostic package written in Python, aimed to be used to evaluate and benchmark simulation output from CESM. Here, we describe diagnostics associated with atmospheric chemistry and dynamics that can impact chemistry (covering both the CCWG and WAWG groups).
The ADF package can be downloaded at https://github.com/NCAR/ADF
...
| Diagnostic | Example Plot/Result | Github Issue |
|---|---|---|
1. Chemistry/Aerosol budget Tables Tables / Chemistry of ANN global budgets |
| COMPLETE https://github.com/NCAR/ADF/issues/236 example: https://project.cgd.ucar.edu/projects/ADF/chem-diags/budget-tables/html_table/mean_tables.html |
1a. Emission analysis | Time series and tables |
|
2. Zonal Average comparisons between model runs. Vertical Contour Plots contour plots of DJF, MAM, JJA, SON and ANN zonal means List of species to evaluate: TBD |  | Now with absolute and relative differences. |
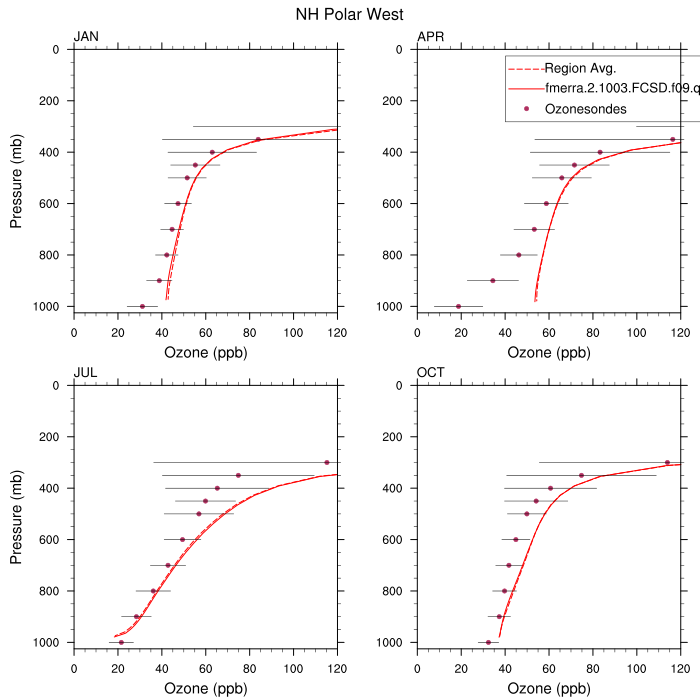
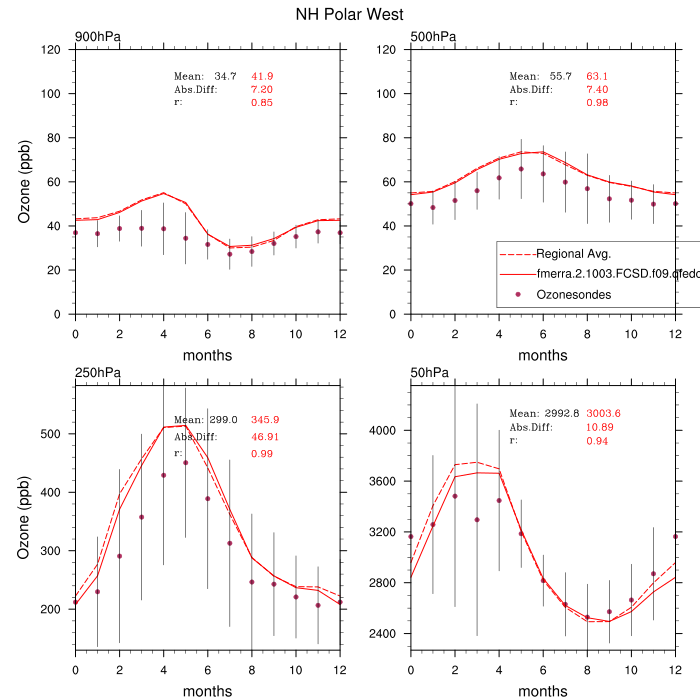
3. Ozone climatology comparison to observations Profiles, seasonal cycles and Taylor diagrams |
| https://github.com/NCAR/ADF/issues/281 Now in the main branch. Has one minor text error with the case name and/or nickname labels that will be addressed in a later fix. |
4. Column comparison to satellite observations Lat/lon comparisons for |
| (a) CO: https://github.com/NCAR/ADF/issues/235 (b) O3: https://github.com/NCAR/ADF/issues/242 (c&d) AOD: COMPLETE |
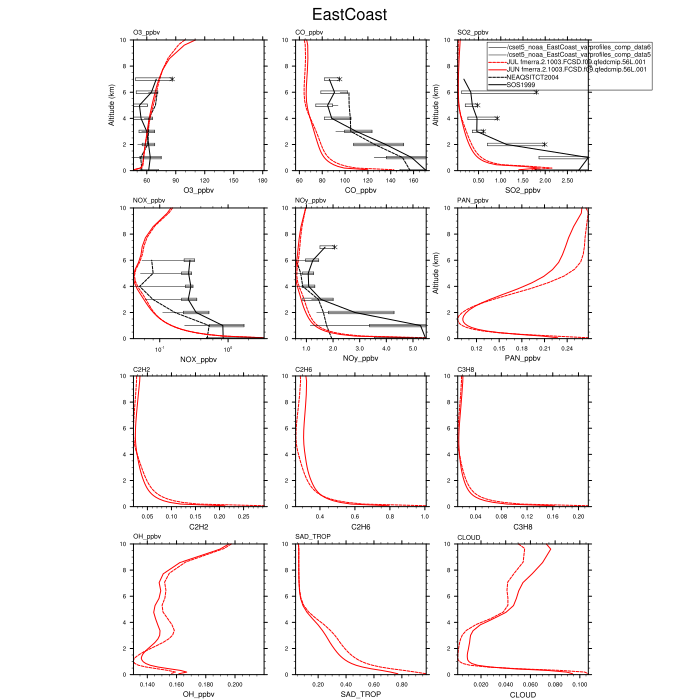
5. Vertical profile comparisons to observations (a) NOAA aircraft campaigns |
| |
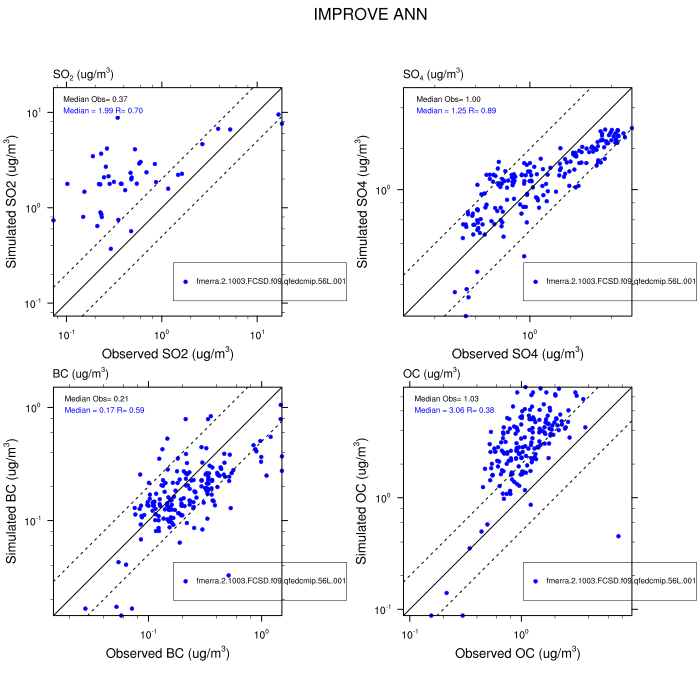
6. Surface comparisons to observations (a) IMPROVE network |
| |
7. Water vapor tape recorder |
| COMPLETE https://github.com/NCAR/ADF/issues/332 Color table adjusted to 1.5 - 3.5. Currently changed in pull request #339. |
8. Composition map difference plots |
| COMPLETE https://github.com/NCAR/ADF/issues/331 Pull request #339 initiated. Adds percent change panel to polar, zonal, meridional, and lat/lon plots. |


...