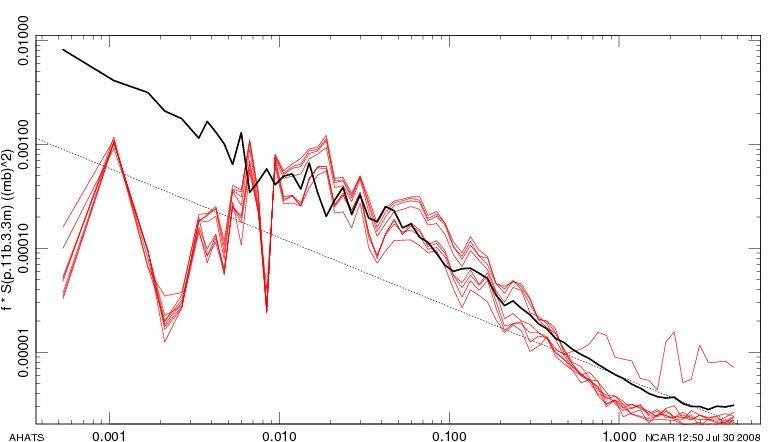
Here is an example from yesterday (1700-1730) of spectra (top panel) and cospsectra (bottom). The black line in the top panel is the spectrum of just the reference pressure (not connected to the atmosphere in any way). The red lines are all the sensors at 5m. Low frequencies in the reference pressure are due to drift in the CHATS reference volume due to changing soil temperature. Note that the signal-to-noise ratio from 0.01 to 1 Hz is on the order of one. (Actually, much better that the factor of 10 I've seen earlier in this case.) Also note that the high frequencies appear to be dominated by instrument noise for frequencies above 1Hz. Unfortunately, this is the frequency range of the subgridscale fluctuations.
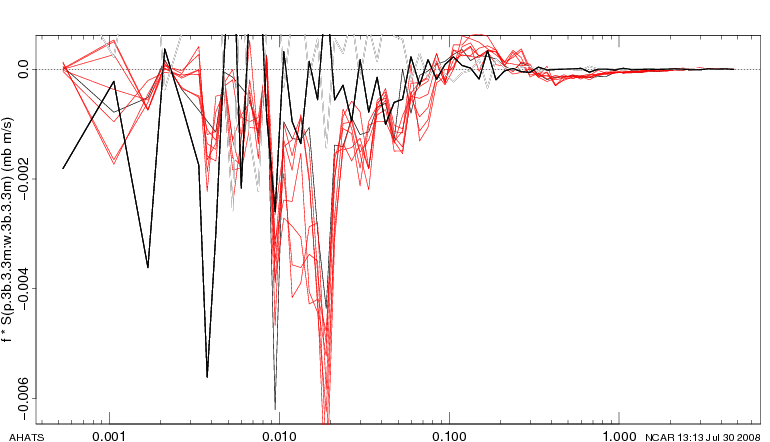
The bottom panel has the w'p' cospectra for all of the 5m sensors (no significance to the color change -- sorry). The thick black line again is w'p' cospectrum of the reference pressure. It has noise, but definitely is a smaller signal than for real pressure. Note the "ringing" (change from - to +) at high frequencies that looks like a phase lag. I played with the data a bit and found that It would take about a 2 second lag to replicate this. I have no idea how such a lag could get into our system.
Overview
Content Tools