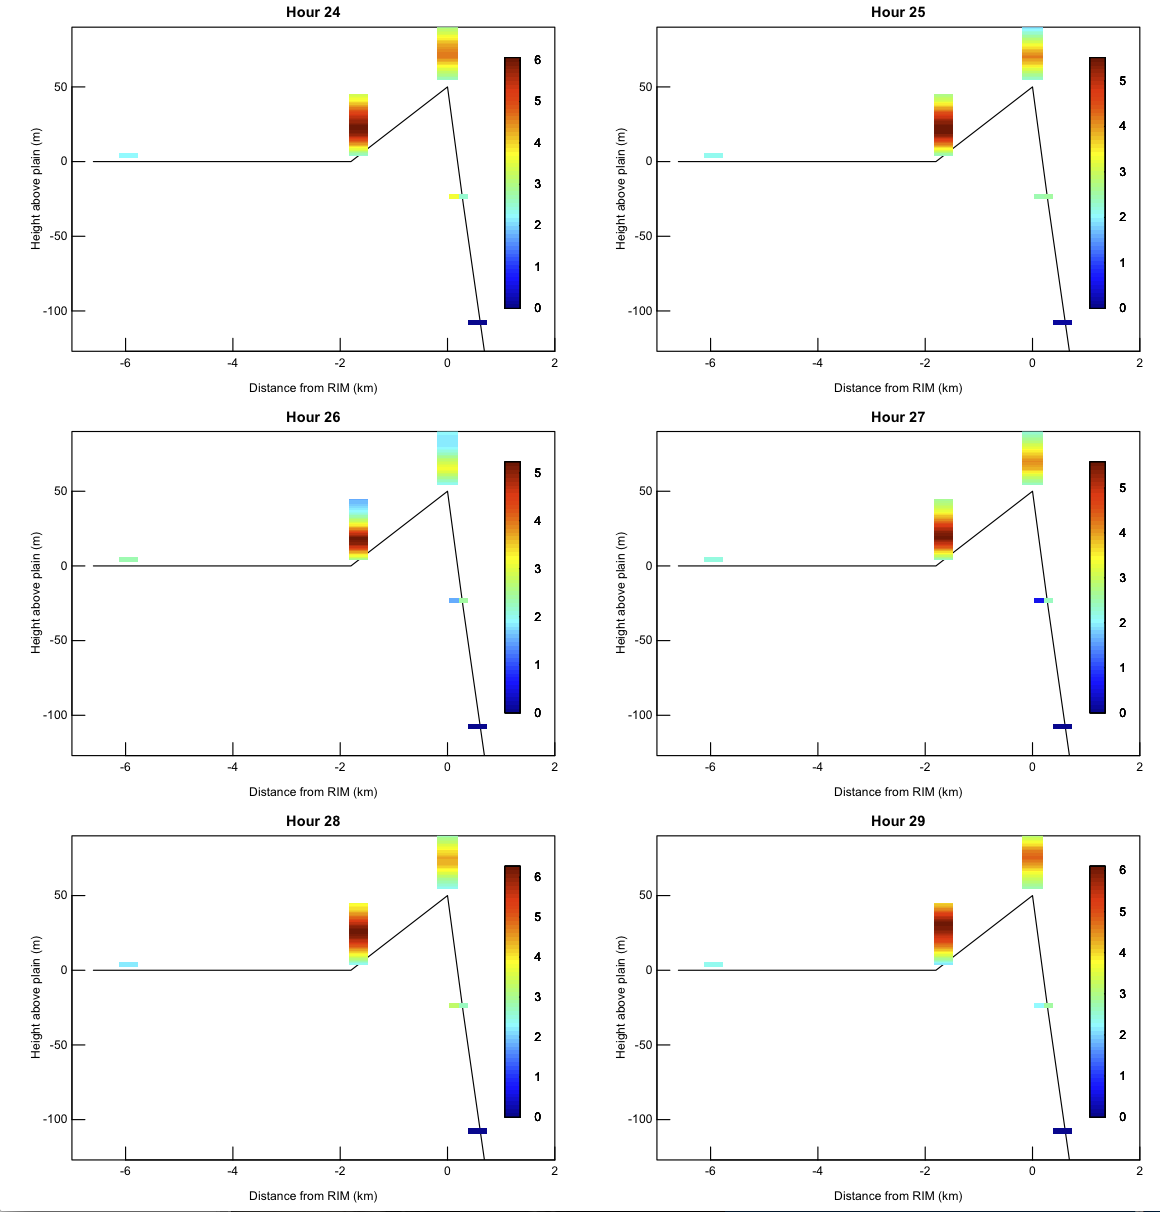
Just for fun, the plot below attempts to display all of the winds (one-hour averages) during the morning 00-06 Oct 06. In all of these profiles, there is a jet in the middle of both the NEAR and RIM profiles. I've shown winds from the other towers as an appropriately-colored rectangle (two in the case of the 2 slope sites). (I tried giving all the data to the image function, but a color mess resulted.)
I've put the code (<mostly> in R) for this in the METCRAXII project R directory.