We have all the sensors and the data system running in the staging area. We've added one Licor 7500 to what was last on the tower, for a total of 4 Licors. The data cables, and Licor power cables are different however, since the originals were left on the tower.
After setting it up, I increased the 4 Licor 7500s from 10 samples/sec at 9600 baud to 20 samples/sec at 19200 baud.
The spurious interrupts are happening, sometimes spiking to above 100:
Jun 28 21:27:02 manitou kernel: viper_irq_handler: irq=2 spurious= 326001, #/sec=102
Jun 28 21:27:21 manitou kernel: viper_irq_handler: irq=2 spurious= 328001, #/sec=109
Jun 28 21:29:06 manitou kernel: viper_irq_handler: irq=2 spurious= 338001, #/sec=102
Jun 28 21:29:46 manitou kernel: viper_irq_handler: irq=2 spurious= 342001, #/sec=106
Jun 28 21:29:56 manitou kernel: viper_irq_handler: irq=2 spurious= 343001, #/sec=102
Jun 28 21:30:38 manitou kernel: viper_irq_handler: irq=2 spurious= 347001, #/sec=103
Jun 28 21:30:48 manitou kernel: viper_irq_handler: irq=2 spurious= 348001, #/sec=101
Jun 28 21:31:28 manitou kernel: viper_irq_handler: irq=2 spurious= 352001, #/sec=111
Jun 28 21:31:58 manitou kernel: viper_irq_handler: irq=2 spurious= 355001, #/sec=104

root@manitou root# uptime
 21:44:36 up  1:43,  1 user,  load average: 0.16, 0.11, 0.09
The kernel issues a "spurious" message when they occur more often than 100/sec. The system came up at 21:44 - 1:43 = 20:01. At the time of the last message above, the system had been up for 1 hour 31 minutes. 355001 interrupts in 1 hour 31 minutes averages to 65/sec.
The above test is with the same kernel (2.6.16.28-arcom1-2-viper #1 PREEMPT Wed Sep 16 17:04:19 MDT 2009) and CPU (viper 4) as was deployed on the tower.
manitou:/dev/ttyS9           1     20        14 2012 06 28 23:13:12.975  06 28 23:13:26.005    1.00  0.938  1.043   19   19
manitou:/var/tmp/gps_pty0    1     30        29 2012 06 28 23:13:12.574  06 28 23:13:26.574    2.00  0.154  0.882   72   73
manitou:/dev/ttyS1           1    100       285 2012 06 28 23:13:12.624  06 28 23:13:26.820   20.01  0.046  0.054   12   12
manitou:/dev/ttyS5           1    120        15 2012 06 28 23:13:12.893  06 28 23:13:26.489    1.03  0.965  0.979   30   30
manitou:/dev/ttyS6           1    200       285 2012 06 28 23:13:12.654  06 28 23:13:26.852   20.00  0.044  0.058   12   12
manitou:/dev/ttyS7           1    210       285 2012 06 28 23:13:12.619  06 28 23:13:26.814   20.01  0.042  0.059   56   56
manitou:/dev/ttyS8           1    220        14 2012 06 28 23:13:13.516  06 28 23:13:26.256    1.02  0.974  0.986   29   29
manitou:/dev/ttyS10          1    300       285 2012 06 28 23:13:12.652  06 28 23:13:26.854   20.00  0.041  0.061   12   12
manitou:/dev/ttyS11          1    310       285 2012 06 28 23:13:12.621  06 28 23:13:26.825   19.99  0.045  0.056   49   49
manitou:/dev/ttyS12          1    320        15 2012 06 28 23:13:13.098  06 28 23:13:26.775    1.02  0.971  0.986   29   29
manitou:/dev/ttyS19          1    330         3 2012 06 28 23:13:10.785  06 28 23:13:20.787    0.20  5.000  5.002   56   56
manitou:/dev/ttyS13          1    400       285 2012 06 28 23:13:12.658  06 28 23:13:26.858   20.00  0.046  0.054   12   12
manitou:/dev/ttyS14          1    410       286 2012 06 28 23:13:12.593  06 28 23:13:26.845   20.00  0.047  0.052   49   49
manitou:/dev/ttyS15          1    420        14 2012 06 28 23:13:13.374  06 28 23:13:26.024    1.03  0.969  0.980   30   30
manitou:/dev/ttyS20          1    500       286 2012 06 28 23:13:12.622  06 28 23:13:26.869   20.00  0.047  0.053   12   12
manitou:/dev/ttyS17          1    510       285 2012 06 28 23:13:12.619  06 28 23:13:26.824   19.99  0.042  0.058   49   49
manitou:/dev/ttyS18          1    520        14 2012 06 28 23:13:13.284  06 28 23:13:25.990    1.02  0.970  0.984   30   30
Gordon Jun 27, 2012
After removing the sensors and data system, we're testing the set up back in Boulder, to see if we can duplicate the problem of not being able to sample 5 licors.
In setting up the test, noticed that the fan on TRH012 does not run, but the TRH does output data. Checking the data archive, that unit is data id 1,420, which was the 30 meter TRH. Will check with Chris in case he noticed whether the fan was running when he removed the sensor.
If the fan was out while the unit was on the tower, then T,RH at 30m data should be treated with suspicion. By looking at the profiles, one might be able to determine when the fan went out.
According to Ned, it is very likely that the fan connection was damaged when the unit was removed from the tower.
The entire turbulence tower was down from May 31 until June 8. During this time, we were able to ping the datalogger but unable to log in. Richard Oakes from the USFS cycled the power on the datalogger at about 2pm on June 8, which restored access to the system.
All sensors came happily back to life, with the exception of the 2m LiCor that Gordon was able to resuscitate via sending ASCII commands to the sensor.
Comments added by Gordon:
From a phone conversation with Richard Oakes: He recalled a hail and lightning storm in the vicinity of the MFO during the afternoon and early evening of May 31, and that his wife noticed a lightning strike that she thought was in the vicinity of the turbulence tower that afternoon. His record indicates just 0.01 inch of precip on May 31.
To bring back the 2m licor, I used the commands shown in https://wiki.ucar.edu/x/CAK9B:
adn
minicom ttyS2
ctrl-a w  (enable line wrap)
ctrl-a e  (enable local echo)
ctrl-a f  (send BREAK)
(Outputs (BW 10) (Delay 0) (RS232 (Freq 10.0)))
ctrl-a q
aup
The turbulence tower data had not been updating since March 17. A site visit by Ned found that the network issue preventing communication was associated with the 5-port Linksys/Cisco switch located in the waterproof power enclosure at the tower. Cycling the power on the switch brought back the network.

Who: Ned, Christopher
When: December 15, 2011. Arrived 9:51am, Departed 12:00pm
Removed Licor (sn 1176) from 15m.
Note, by Gordon, Jul 13, 2012: There is no sn1176. I think this must have been unit sn1167, which according to the log entry of 4/12/2011, was installed at 15m.
When removing this sensor due to bad chopper motor, it was not running. Rebooted sensor and heard the chopper motor in the head and it sounded bad. Removed the 7m Licor (sn0813) and taped up connections and moved this Licor to the 15m height. Plugged in all connections as normal (signal green cable and power through BNC). All looked (and sounded) great. Replaced the TRH fans at heights 7m and 15m. Both fans sounded REALLY bad. The 2m TRH fan did not sound very good either. Guessing we will be replacing that fan soon.
*Did notice that when the Licor 1176 was at 15m and before removal I checked power at the inside green connector. Voltage was going from 12.9V to 11.4V every six seconds. Odd cycle, but this also seemed odd in general. Checked the power at the 7m height when removing that Licor and it had the same cycle but not as drastic. Took a voltage reading at dsm, voltage was cycling. Took reading at battery bank and did see the cycle but not as drastic. Noticed the battery charger was pulsing to charge the battery bank. It was on the 'deep cycle'. We switched charger to 'conventional cycle' and it all stopped. No more voltage swings. We also wanted to know why the batteries were not taking out that pulsing to the tower. One of the batteries must be bad or wrong charger for batteries. We unplugged the charger to see what the load did on the batteries, checking for bad battery. In 15minutes we dropped from 13.10V to 12.47V. Not much of a drop. Leaning to more of the wrong charger cycle and will monitor the battery bank on this current setting.
15 m Li-COR (sn1176) dropped out of service on November 6, 2011.
Note, by Gordon, Jul 13, 2012: There is no sn1176. I think this must have been unit sn1167, which according to the log entry of 4/12/2011, was installed at 15m.
The diagnostic value dropped to 215 indicating that Bit 5 signaled that the instrument's chopper motor failed. There was an indication a number of hours earlier that the chopper motor was beginning to fail, see:
http://www.eol.ucar.edu/isf/projects/BEACHON_SRM/isfs/qcdata/plots/2011/11/06/licor_20111106.png
Chris and I made a trip to MFO to move the 7m Li-COR (sn 0813) up to 15m and to remove the dead instrument from 15m. The tower is therefore operating again with three levels of water vapor and CO2 fluxes (2m, 16m, 43m). See Chris' entry for details of this instrument swap and timing.
Gordon, Dec 9 3:15 pm
Since Dec 1 22:50 UTC the DSM log file (/var/log/isfs/adam.log) has error messages that the GPS pseudo-terminal device, /var/tmp/gps_pty0, does not exist. Apparently the tee_tty process died at that time.
tee_tty reads the GPS ASCII messages on /dev/ttyS3, and writes them to two pseudo-terminals /dev/gps0 (read by NTP) and /var/tmp/gps_pty0 (read by dsm).
I'm not sure why tee_tty died, but decided that this was an opportunity to upgrade the NIDAS software on this system. The existing version was 5810M, current as of Nov 9, 2010.
Installed the latest and greatest, version 6364.
During this time I noticed that characters were being lost in the ssh session, such that I had to enter characters twice for them to get to the shell if the dsm process was running. I have a faint memory of this happening before. Determined that this is due to tee_tty exiting, leaving the symbolic links to the pseudo-terminals around. The dsm process re-opens the /var/tmp/gps_pty0 every 10 seconds after an error, and so if sshd creates a pseudo-terminal and /var/tmp/gps_pty0 points to it, then the dsm process will be stealing characters from the ssh session. Did a dump of the GPS data and saw my shell commands! Hacked myself ![]()
Installed a new version of tee_tty, which will catch the HUP, INT and TERM signals, and clean up the symbolic links on exit. Tested it and things look good.
The "spurious" IRQ messages are annoying when one is logged onto the system console at the tower. They are logged at a priority of "warning". They should have a lower priority, like debug, or info, unless the number/sec is above some threshold. Until that change is made, I'll disable them on the console, by setting the "-c 4" option in klogd, which then suppresses messages of warning and lower, which are numeric values 4-8. 3-0 are priorities from error to emerg.
That change was made to /etc/init.d/klogd on Oct 24, 16:45 UTC, and klogd restarted.
To see the spurious messages, do either of the following:
cat /proc/kmsg
dmesg
cat /proc/kmsg removes the messages from the kernel message ring buffer as they are read.
Oct 14, 2011
Arrived: 9am MDT
Departed: 11am MDT
ChrisG and SteveS are on site to diagnose the sick licor 7500 at 16m and add the two licors that were at the CWEX11 project.
Chris could not hear the motor spinning on the 16m Licor 7500. A power cycle did not bring it back. While removing it, when the unit bumped against something, the motor started up, but was much more noisy than usual. It will be brought back for repair.
Installed SN 1167 at 16 meters, and 0813 at 7 meters. 30 meters still has no Licor.
From Boulder I (Gordon) set the sampling rate to 10 Hz and the baud rate to 9600. The Licors had been configured for 20 Hz, 19200 baud. From minicom, after adn:
adn
minicom ttyS7  (or ttyS11)
ctrl-a w  (enable line wrap)
ctrl-a e  (enable local echo)
ctrl-a f  (send BREAK)
(Outputs (BW 10) (Delay 0) (RS232 (Freq 10.0)  (Baud 9600)))
ctrl-a q
aup
They also swapped out the three main batteries.
Also checked tensions.
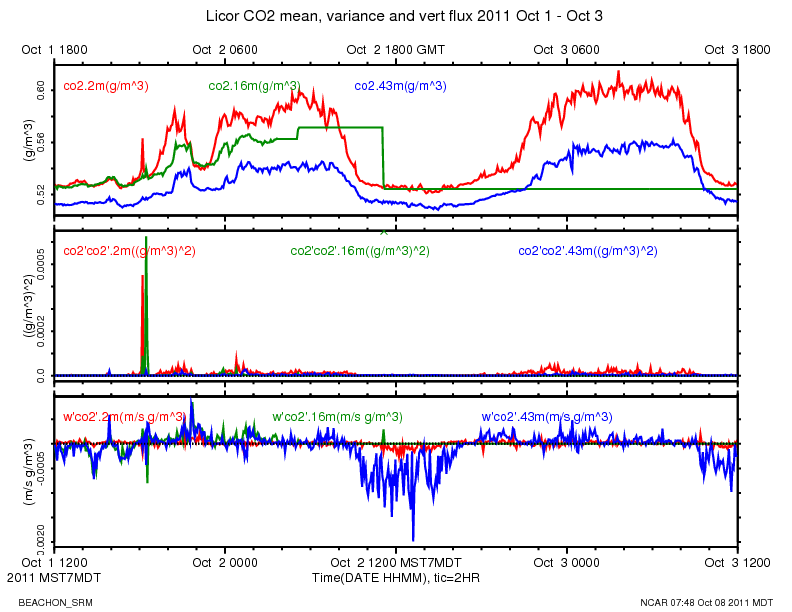
The data from the Licor at 16 meters went bad on Oct 2, while our system was not reachable over the network.
http://www.eol.ucar.edu/isf/projects/BEACHON_SRM/isfs/qcdata/plots/2011/10/02/co2_20111002.png
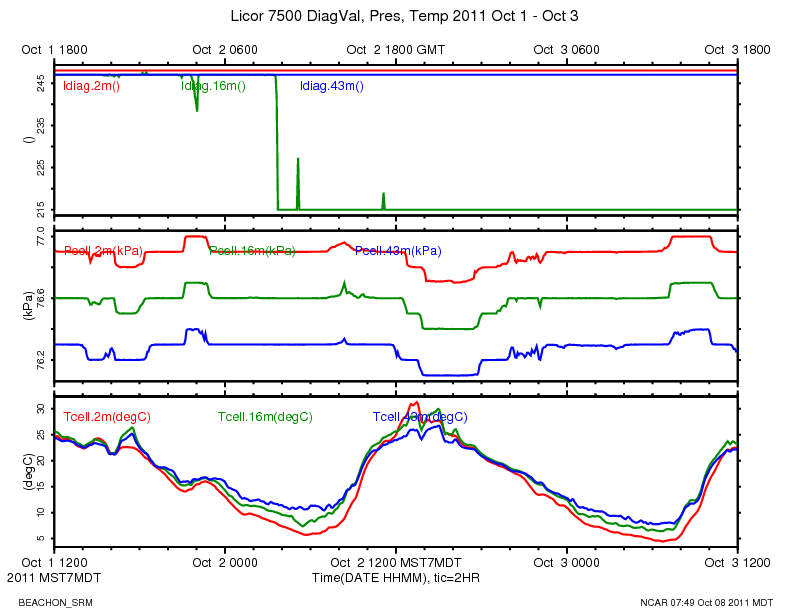
The ldiag averages went from the typical 248-255 range to around 216.
http://www.eol.ucar.edu/isf/projects/BEACHON_SRM/isfs/qcdata/plots/2011/10/02/licor_20111002.png
This CWEX11 logbook entry has some information about the licor diagnostic value:
This morning at around 10:40 MDT, I logged in and looked at the high rate data with rserial. (The 16 meter licor is serial port 11) The diagnostic value is 215 = 11010111 binary. Bit 5 is 0 indicating the PLL is not OK.
According to the manual:
PLL - Phase Lock Loop offset, indicates the status of the chopper motor. If not OK, there may be a problem with the chopper motor in the sensor head.
Also just noticed there is not data on the plots from the 2 meter licor since 04:00 MDT this morning. That appears to be a moisture issue. I just logged in and did rserial (serial port 2):
rs 2
255\t0.11124\tOverflow\t0.11690\tOverflow\t2.77\t76.0\t\n
255\t-45877.11718\tOverflow\t-37005.95312^D\tOverflow\t2.78\t76.0\t\n
255\t-59961.00781\tOverflow\t-110557.73437\tOverflow\t2.77\t76.0\t\n
255\t0.86791\tOverflow\t0.94173\tOverflow\t2.79\t76.0\t\n
The \t are tabs between the values. 255 is the ldiag value, indicating a high AGC value, but all other diagnostic bits are OK. The second and fourth values in a message are the raw values for co2 and h2o, which look crazy, and the calibrated values are "Overflow". This will probably clear up when things dry out.
We have not been able to reach the turbulence tower data system since Sep 29.
We could ping the RAL server in the seatainer from Boulder. Andy Gaydos logged into the server and could not ping the data system: 192.168.100.202. So either the data system or the network between the seatainer and the tower was down.
On Oct 6 I was able to ssh to the DSM. So somebody fixed the problem, or perhaps a fiber<->copper transceiver reset itself.
I did not see anything in /var/log/isfs/messages about eth0 going down/up.
The DSM did not go down, so it wasn't a DSM power problem:
root@manitou root# date
Thu Oct  6 22:44:24 GMT 2011
root@manitou root# uptime
 22:45:18 up 464 days,  3:22,  2 users,  load average: 0.02, 0.05, 0.00
Monitoring the accuracy of the system clock on a real-time data acquisition system provides useful information about the performance of the system. Hence this long discussion.
Data System Clock, NTP and GPS
The data system at the Manitou Forest Observatory (aka, the DSM) uses a GPS receiver and the NTP (Network Time Protocol) software to set the system clock, which, in addition to the normal uses of a system clock, is used to time-tag the data samples.
The serial messages from the GPS are received on serial port 3, /dev/ttyS3. The pulse-per-second square-wave signal (PPS) from the GPS is also connected to the DCD line of that serial port. A patch has been added to the Linux kernel on the data system so that an interrupt function can be registered to run in response to the DCD interrupts. This interrupt function will be called immediately after the rising edge of the PPS signal has been detected by the serial port hardware.
The NTP software on the DSM runs a reference clock driver for a Generic NMEA GPS Receiver, with PPS. This driver reads the 1 second GPS RMC records from the serial port, and registers a function to be run on receipt of the PPS interrupt. NTP then uses these two sets of information to create a GPS reference clock. NTP then monitors the state of the GPS reference clock and the system clock, and makes gradual adjustments to the system clock to bring it to close agreement with the GPS clock.
The RMC records contain the current date and time, in addition to latitude, longitude, and other quantities. The transmission time of the RMC message is not tightly controlled within the GPS and appears to be primarily effected by lags associated with internal GPS processing, and is also likely effected by what other NMEA messages are enabled for output on the GPS. The exact receipt time of the RMC message is not used for clock adjustments. NTP simply uses the time fields within the RMC message as an absolute time label for the previous PPS, whose timing is very precise.
Clock Variables
We monitor the following variables to keep track of the DSM timekeeping, and plot them on the daily web plots:
- GPSdiff: The time difference, in seconds, between the time-tag that was assigned to a RMC message and the date and time that is contained within the message. The time-tag assigned to a message sample is the value of the system clock at the moment the first byte of the message was received. For example, a value of 0.6 sec means that the data system assigned a time-tag to the RMC message that was 0.6 seconds later than the time value contained within the message. As discussed above, GPSdiff is not a precise measurement of clock differences and is not used to adjust the system clock. It gives a crude value of the agreement of the clocks and possible effects of I/O latency and buffering in the data system. When 5 minute statistics are computed, the maximum and minimum values of GPSdiff for each 5 minute period are written to the output NetCDF files as GPSdiff_max and GPSdiff_min.
- GPSnsat: number of satellites being tracked by the receiver, that is, the number of satellites whose signals are used in its time and location solution. GPSnsat in the NetCDF files and plots is a 5 minute mean.
NTP on the DSM is configured to log its status in a "loopstats" file. See http://www.eecis.udel.edu/~mills/ntp/html/monopt.html for information on the NTP monitoring options. The loopstats file includes these variables, which have been merged into the Manitou data archive:
- NTPClockOffset: the estimated offset of the GPS time from the data system time. A positive value indicates that NTP has determined that the GPS clock is ahead of the system clock, i.e. the GPS is showing a later time than the system clock. The maximum, minimum and mean values of NTPClockOffset in each 5 minute period are computed and written to the NetCDF files and plotted as NTPClockOffset_max, NTPClockOffset_min and NTPClockOffset.
- NTPFreqOffset: the correction applied to the system clock frequency in parts-per-million. A positive value indicates that NTP has determined that the system clock oscillator is slow and the NTPFreqOffset PPM values are being added periodically to the system clock counter. The NetCDF files and plots contain 5 minute means of NTPFreqOffset.
The NTP logs have not been recorded consistently since the beginning of the project. Year 2010 data from May 3 to August 12th and Oct 14th to November 9th are available, as well as all data from April 9, 2011 onward.
Replacement of Garmin GPS
On April 12, 2011 the old Garmin GPS 25-HVS at the tower was replaced with a newer Garmin 18x-LVC model. The model numbers are shown in the $PGRMT messages in the archive, where the time is UTC:
data_dump -i 1,30 -A manitou_20110412_120000.bz2 | fgrep PGRMT
...
2011 04 12 16:41:39.6568    0.15      49 $PGRMT,GPS 25-HVS VER 2.50 ,P,P,R,R,P,,23,R*08\r\n
2011 04 12 16:42:50.4248  0.1249      51 $PGRMT,GPS 18x-LVC software ver. 3.10,,,,,,,,*6D\r\
Unexpectedly, the newer GPS provided much better time-keeping.
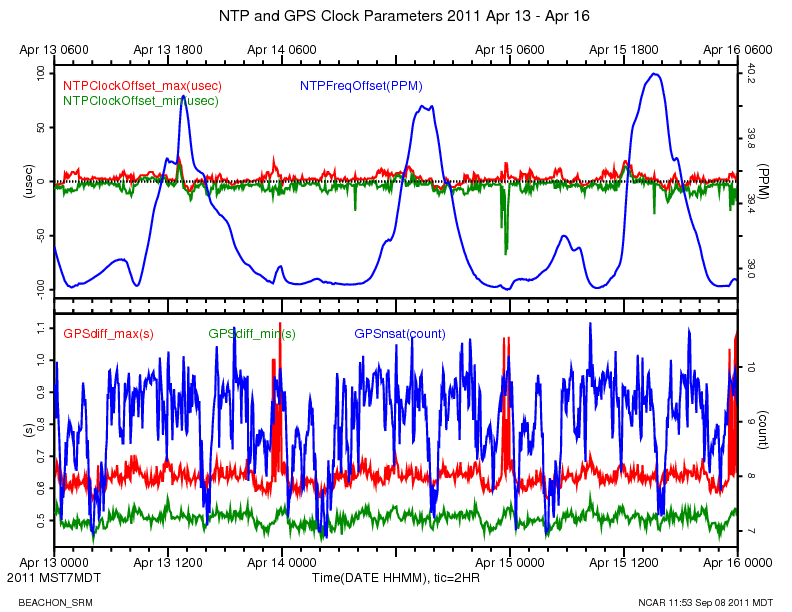
The following plot is for the old 25-HVS model for 3 days prior to the swap:
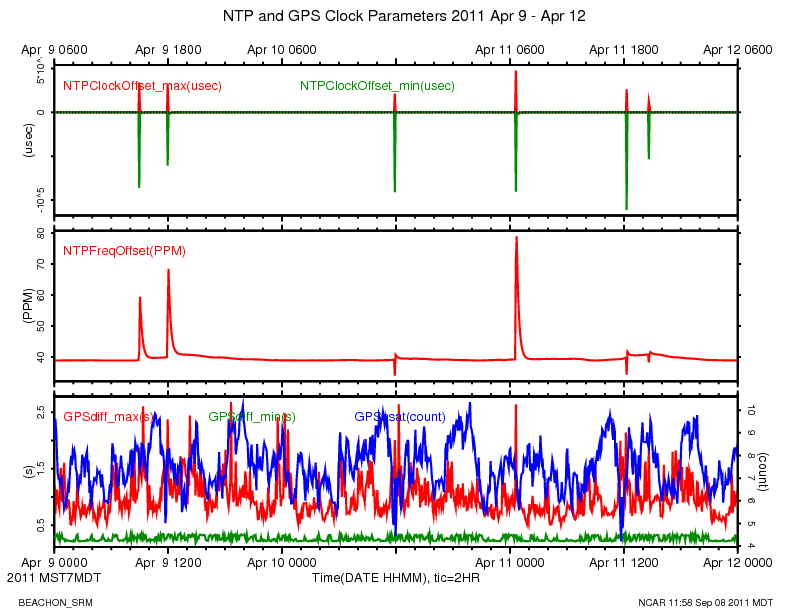
The NTPClockOffset shows spikes between -100000 to 50000 microseconds during this period, which is much worse than expected for a GPS/NTP reference clock. The spikes in NTPClockOffset are simultaneous with positive jumps in GPSdiff_max, up to as much as 2.5 seconds. These events seem to happen when the number of tracked satellites changes, which indicates that internal processing lags in the 25-HVS cause it to report late, causing large values of GPSdiff. The extent of this effect on the timing of the PPS signal is unknown.
The following plot shows a close up of one of the clock offset spikes using un-averaged data:
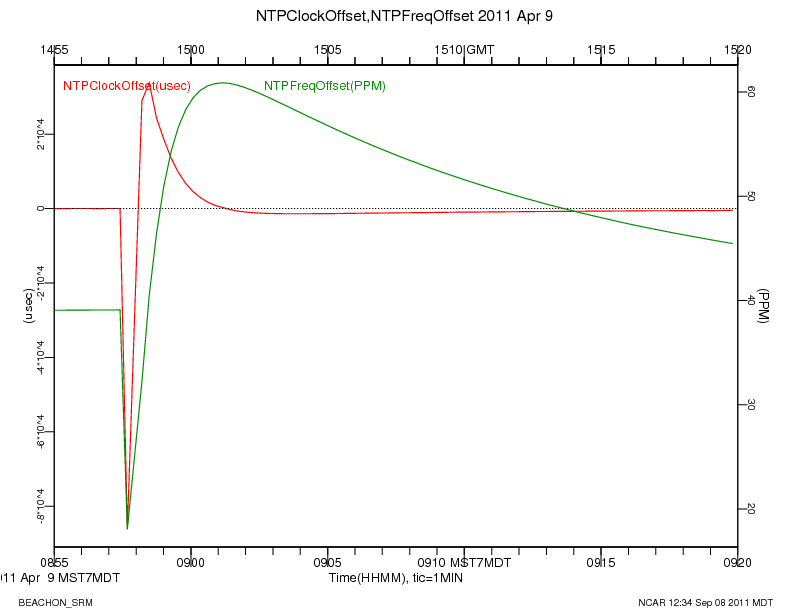
The sudden downward jump in NTPClockOffset causes NTP to think that the GPS clock is earlier than the system clock. NTP starts to correct for the offset by slowing down the system clock, as seen in the negative values for NTPFreqOffset. When the GPS recovers from its delayed reporting, NTP then sees positive values for NTPClockOffset and adjusts the system clock ahead.
After installing 18x-LVC, the NTPClockOffset is in a much improved range, from -70 to 25 microseconds. NTPFreqOffset is also in a much tighter range, indicating that NTP is applying smaller corrections to the system clock. GPSdiff is also much better behaved, ranging from a minimum of 0.5 to 1.1 seconds. The number of satellites tracked by the new GPS is also generally higher.
Temperature Effects
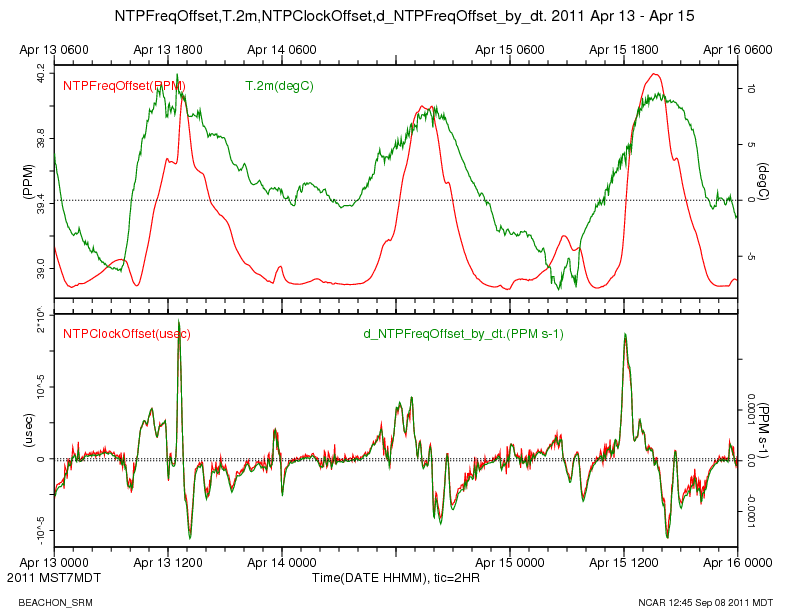
The frequency offset shows a temperature dependence in the system clock oscillator. We do not measure the temperature inside the data system enclosure, which is at the base of the tower. The nearest temperature measurement is of the ambient air at 2 meters up the tower. The top panel in the plot below shows a time series of the air temperature, along with NTPFreqOffset, for a cool 3 day period in April, after the installation of the new GPS. It appears that when the air temperature is below 5 deg C, the system clock oscillator does not show an obvious temperature relation.
The bottom panel shows a close relationship between the NTPClockOffset and the time derivative of NTPFreqOffset, which, I believe, indicates how NTP adjusts the system clock based on the measured offset. It also enforces the obvious conclusion that we could improve the time-keeping by insulating the CPU from temperature changes.
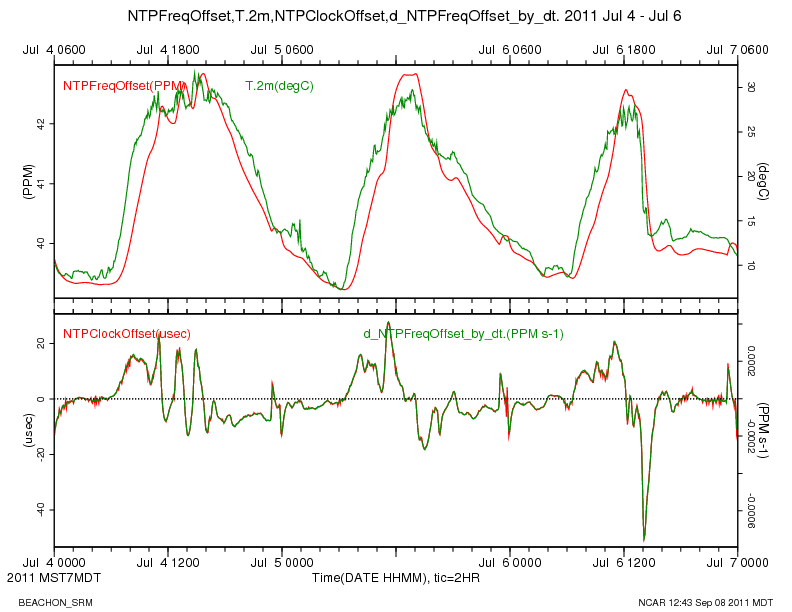
On a warmer 3 day period in July, where the temperatures were all above 5 degC, the temperature effect on the system clock oscillator is very evident.
Time Offsets During File Transfers
The periodic spikes in GPSdiff_max up to 1 second that occur at 23:00 local time and last about an hour, are simultaneous with the network transfer of the day's data files from the DSM to the RAL server. These suggest that increased sample buffering and latency is happening at these times, which needs to be investigated and improved.
A close-up of the file transfer on April 14, 23:00, plotted below, shows several events where NTPClockOffset first has a negative spike, indicating that NTP has determined that the GPS clock is behind the system clock and starts to slow down the system clock. These down spikes appear to be due to a delay in the response to a PPS interrupt. The interrupt latency appears to be short lived, because the NTPClockOffset becomes positive, and the system clock is re-adjusted. The April 14 transfer is shown in this plot:
![]()
In July, the clock behaviour during the file transfer is similar, but the initial increase in NTPClockOffset and a rising slope in NTPFreqOffset might be due to increased heating of the system clock oscillator, due to increased CPU load during the file transfers. Wild conjecture? After a quick scan of the web plots of 5 minute averages, I think these positive bumps in NTPFreqOffset seem to occur during file transfers when the outside air temperatures are above 0 C, and don't occur in colder conditions.
![]()
ppstest and ntpq
On the DSM, the ppstest program is helpful for gaining an understanding of the system and GPS clocks. It displays the system clock value when the interrupt function is called at the time of the assertion and the clear of the PPS signal. Do ctrl-C to terminate ppstest.
root@manitou root# ppstest /dev/ttyS3
trying PPS source "/dev/ttyS3"
found PPS source #3 "serial3" on "/dev/ttyS3"
ok, found 1 source(s), now start fetching data...
source 0 - assert 1315494544.999995675, sequence: 37249847 - clear  1315494544.099998000, sequence: 37249862
source 0 - assert 1315494544.999995675, sequence: 37249847 - clear  1315494545.099995000, sequence: 37249863
source 0 - assert 1315494545.999994675, sequence: 37249848 - clear  1315494545.099995000, sequence: 37249863
source 0 - assert 1315494545.999994675, sequence: 37249848 - clear  1315494546.099993000, sequence: 37249864
source 0 - assert 1315494546.999994675, sequence: 37249849 - clear  1315494546.099993000, sequence: 37249864
ctrl-C
The above sequence shows that the system clock is behind the GPS. The system time when the interrupt function is being called on the PPS assert is 5 microseconds before the exact second (0.999995). This corresponds to a NTPClockOffset of a positive 5 microseconds. This is confirmed with the ntpq program (which reports its offset in milliseconds):
root@manitou root# ntpq -p
     remote           refid      st t when poll reach   delay   offset  jitter
==============================================================================
xral             38.229.71.1      3 u   34   64  377    0.320    3.804   0.031
 LOCAL(0)        .LOCL.          10 l  93d   64    0    0.000    0.000   0.000
oGPS_NMEA(0)     .GPS.            2 l    6   16  377    0.000    0.005   0.031
The ntpq output indicates (with the leading 'o') that NTP is using the GPS as the system's reference clock. It also displays the offset of the RAL server's clock of 3.804 milliseconds, and indicates with an 'x' that it is not using that clock as a reference. The RAL server uses NTP over a WIFI connection to adjust its clock, so it is not as accurate as the DSM.
The loopstats file also shows the 5 usec offset at this time:
55812 54504.454 0.000005000 39.301 0.000030518 0.001408 4
55812 54520.455 0.000006000 39.302 0.000030518 0.001415 4
55812 54536.454 0.000005000 39.303 0.000030518 0.001392 4
55812 54552.454 0.000005000 39.305 0.000030518 0.001372 4
I do not believe I've seen a jitter value less than 31 microseconds. Not sure why that is. I believe the jitter is the standard deviation of the offset, but the NTP documentation is rather unclear to me.
The 5 minute statistics of data from the turbulence tower, for the entire dataset, Jul 8 2009 to the present have been recomputed, and written to the NetCDF files. The new values incorporate the following changes:
- In each 20 Hz sample from a CSAT3 sonic, if any of the CSAT diagnostic bits are non-zero, then the values for that sample (u,v,w,tc) are marked as missing, and not added to the 5 minute statistics. This should result in better 5 minute statistics by excluding data when the transducer signals are poor, such as during rain.
- The calculation of the CSAT3 sonic diag value has changed. Previously the high-rate value could vary from 0 to 31, depending on which diagnostic bit was set. Now the high-rate diag value is just a 0 (no bits set) or 1 (one more more bits set), and the average is now the fraction of time in the 5 minute period that one or more diagnostic bits were set.
- The LICOR 7500's have a inherent sampling lag of 0.186 seconds, as documented in the manual from Licor. Our previous processing did not account for that lag when computing covariances between the sonic winds and the h2o and co2 from the Licor. This could result in increased values for the computed fluxes of water vapor and CO2.
- Units of CO2 have been changed from mmol/m^3 to g/m^3, the same as for H2O from the 7500s.
Aug 15, 11:10 MDT
Logged into the DSM and checked that the Licor 7500 delay parameter was set to 0 on all units. Shut down the data process, and used minicom. Do "(Outputs ?)" to query the, and "(Outputs (BW 10))" to resume the licor output.
Conclusion: all Delay values were set to 0, as they should be.
adn
minicom ttyS2
ctrl-A w   (enable line wrap)
ctrl-A e   (enable echo)
ctrl-A f   (send break)
(Outputs ?)
(Outputs (BW 10))
ctrl-A q   (quit minicom)
aup
ttyS2, 2m:
Outputs (BW 10)(Delay 0)(SDM (Address 7))(Dac1 (Source NONE)(Zero 0)(Full 5))(Dac2 (Source NONE)(Zero 0)(Full 5))(RS232 (Baud 9600)(Freq 1e
1)(Pres TRUE)(Temp TRUE)(Aux FALSE)(Cooler FALSE)(CO2Raw TRUE)(CO2D TRUE)(H2ORaw TRUE)(H2OD TRUE)(Ndx FALSE)(DiagVal TRUE)(DiagRec FALSE)(L
abels FALSE)(EOL "0A")))
ttyS11, 16m:
(Outputs (BW 10)(Delay 0)(SDM (Address 7))(Dac1 (Source NONE)(Zero 0)(Full 5))(Dac2 (Source NONE)(Zero 0)(Full 5))(RS232 (Baud 9600)(Freq 1
e1)(Pres TRUE)(Temp TRUE)(Aux FALSE)(Cooler FALSE)(CO2Raw TRUE)(CO2D TRUE)(H2ORaw TRUE)(H2OD TRUE)(Ndx FALSE)(DiagVal TRUE)(DiagRec FALSE)(
Labels FALSE)(EOL "0A")))
ttyS17, 43m:
(Outputs (BW 10)(Delay 0)(SDM (Address 7))(Dac1 (Source NONE)(Zero 0)(Full 5))(Dac2 (Source NONE)(Zero 0)(Full 5))(RS232 (Baud 9600)(Freq 1
e1)(Pres TRUE)(Temp TRUE)(Aux FALSE)(Cooler FALSE)(CO2Raw TRUE)(CO2D TRUE)(H2ORaw TRUE)(H2OD TRUE)(Ndx FALSE)(DiagVal TRUE)(DiagRec FALSE)(
Labels FALSE)(EOL "0A")))