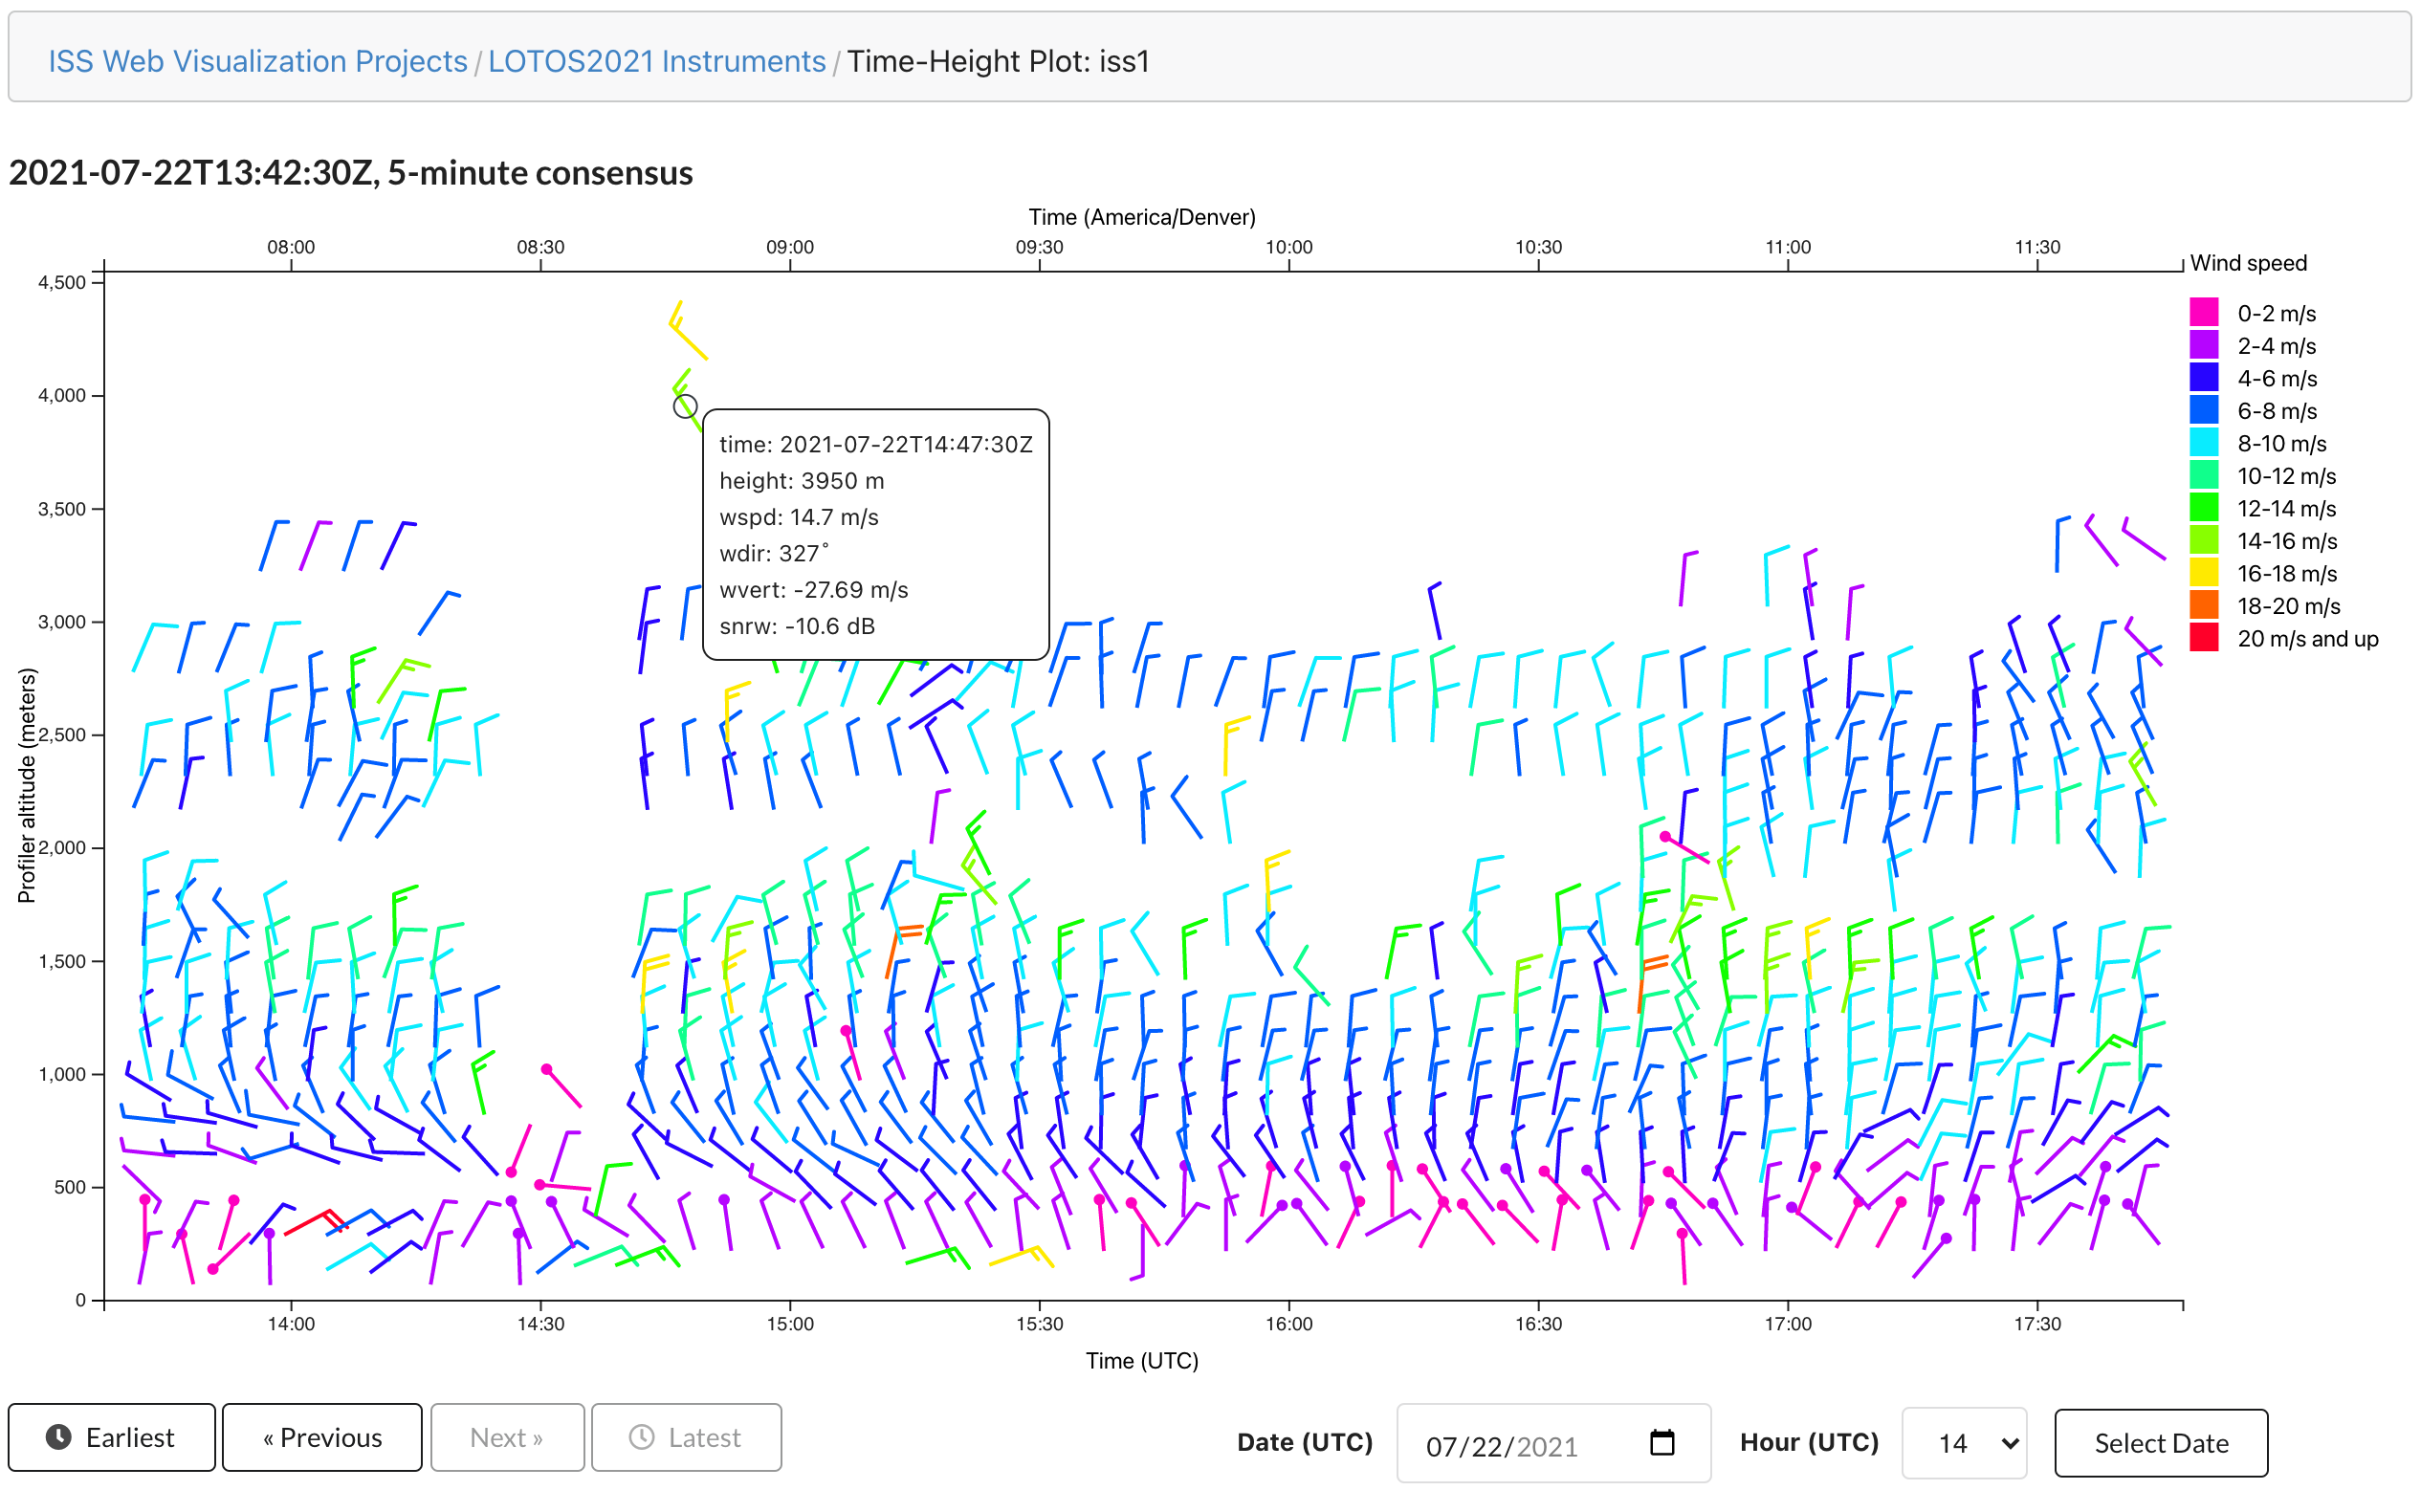
5-minute-consensus wind data from the ISS1 profiler (449MHz) at Marshall is available in the time-height-plot web-visualization tool that I have been working on:
Data for the extent of the project / all that is available in NetCDF files for 5-minute ISS1 is available in the time-height-plot.
New data for the current day is loaded at 10 minutes after the top of every hour (following generation of winds data at the top of every hour).
Color-coded windbarbs are displayed for profiles and temporal navigation is available via the buttons under the plot. Hovering over the spine of a windbarb reveals a popup with data for the profile.
I am currently working on supporting 30-minute-consensus ISS1 data and NIMA ISS4 (915MHz) data, hoping that will be available in the near future.
Thanks to everyone who has worked on generating the profiler data and NetCDF files!
The application uses responsive sizing to adapt to different display widths, but display on mobile devices, especially phones, has not received attention yet, so may not be all that great.
I have been working with Bill on displaying data from the profiler running at Foothills and things seem to be working well. Data for duration of project available here, updating with new data hourly: