") THIS PAGE IS VERY MUCH A WORK IN PROGRESS since I'm still learning how to use all the tools to build a wiki page with links and figures. I'm pondering how best to add some "dialogue" to the ppt presentation. My thinking so far is to create a separate document that describes various aspects of the ppt slides. I envision the user opening the ppt in one window along with descriptive text in another window, but it's not yet clear to me whether this be workable.
THIS PAGE IS VERY MUCH A WORK IN PROGRESS since I'm still learning how to use all the tools to build a wiki page with links and figures. I'm pondering how best to add some "dialogue" to the ppt presentation. My thinking so far is to create a separate document that describes various aspects of the ppt slides. I envision the user opening the ppt in one window along with descriptive text in another window, but it's not yet clear to me whether this be workable.
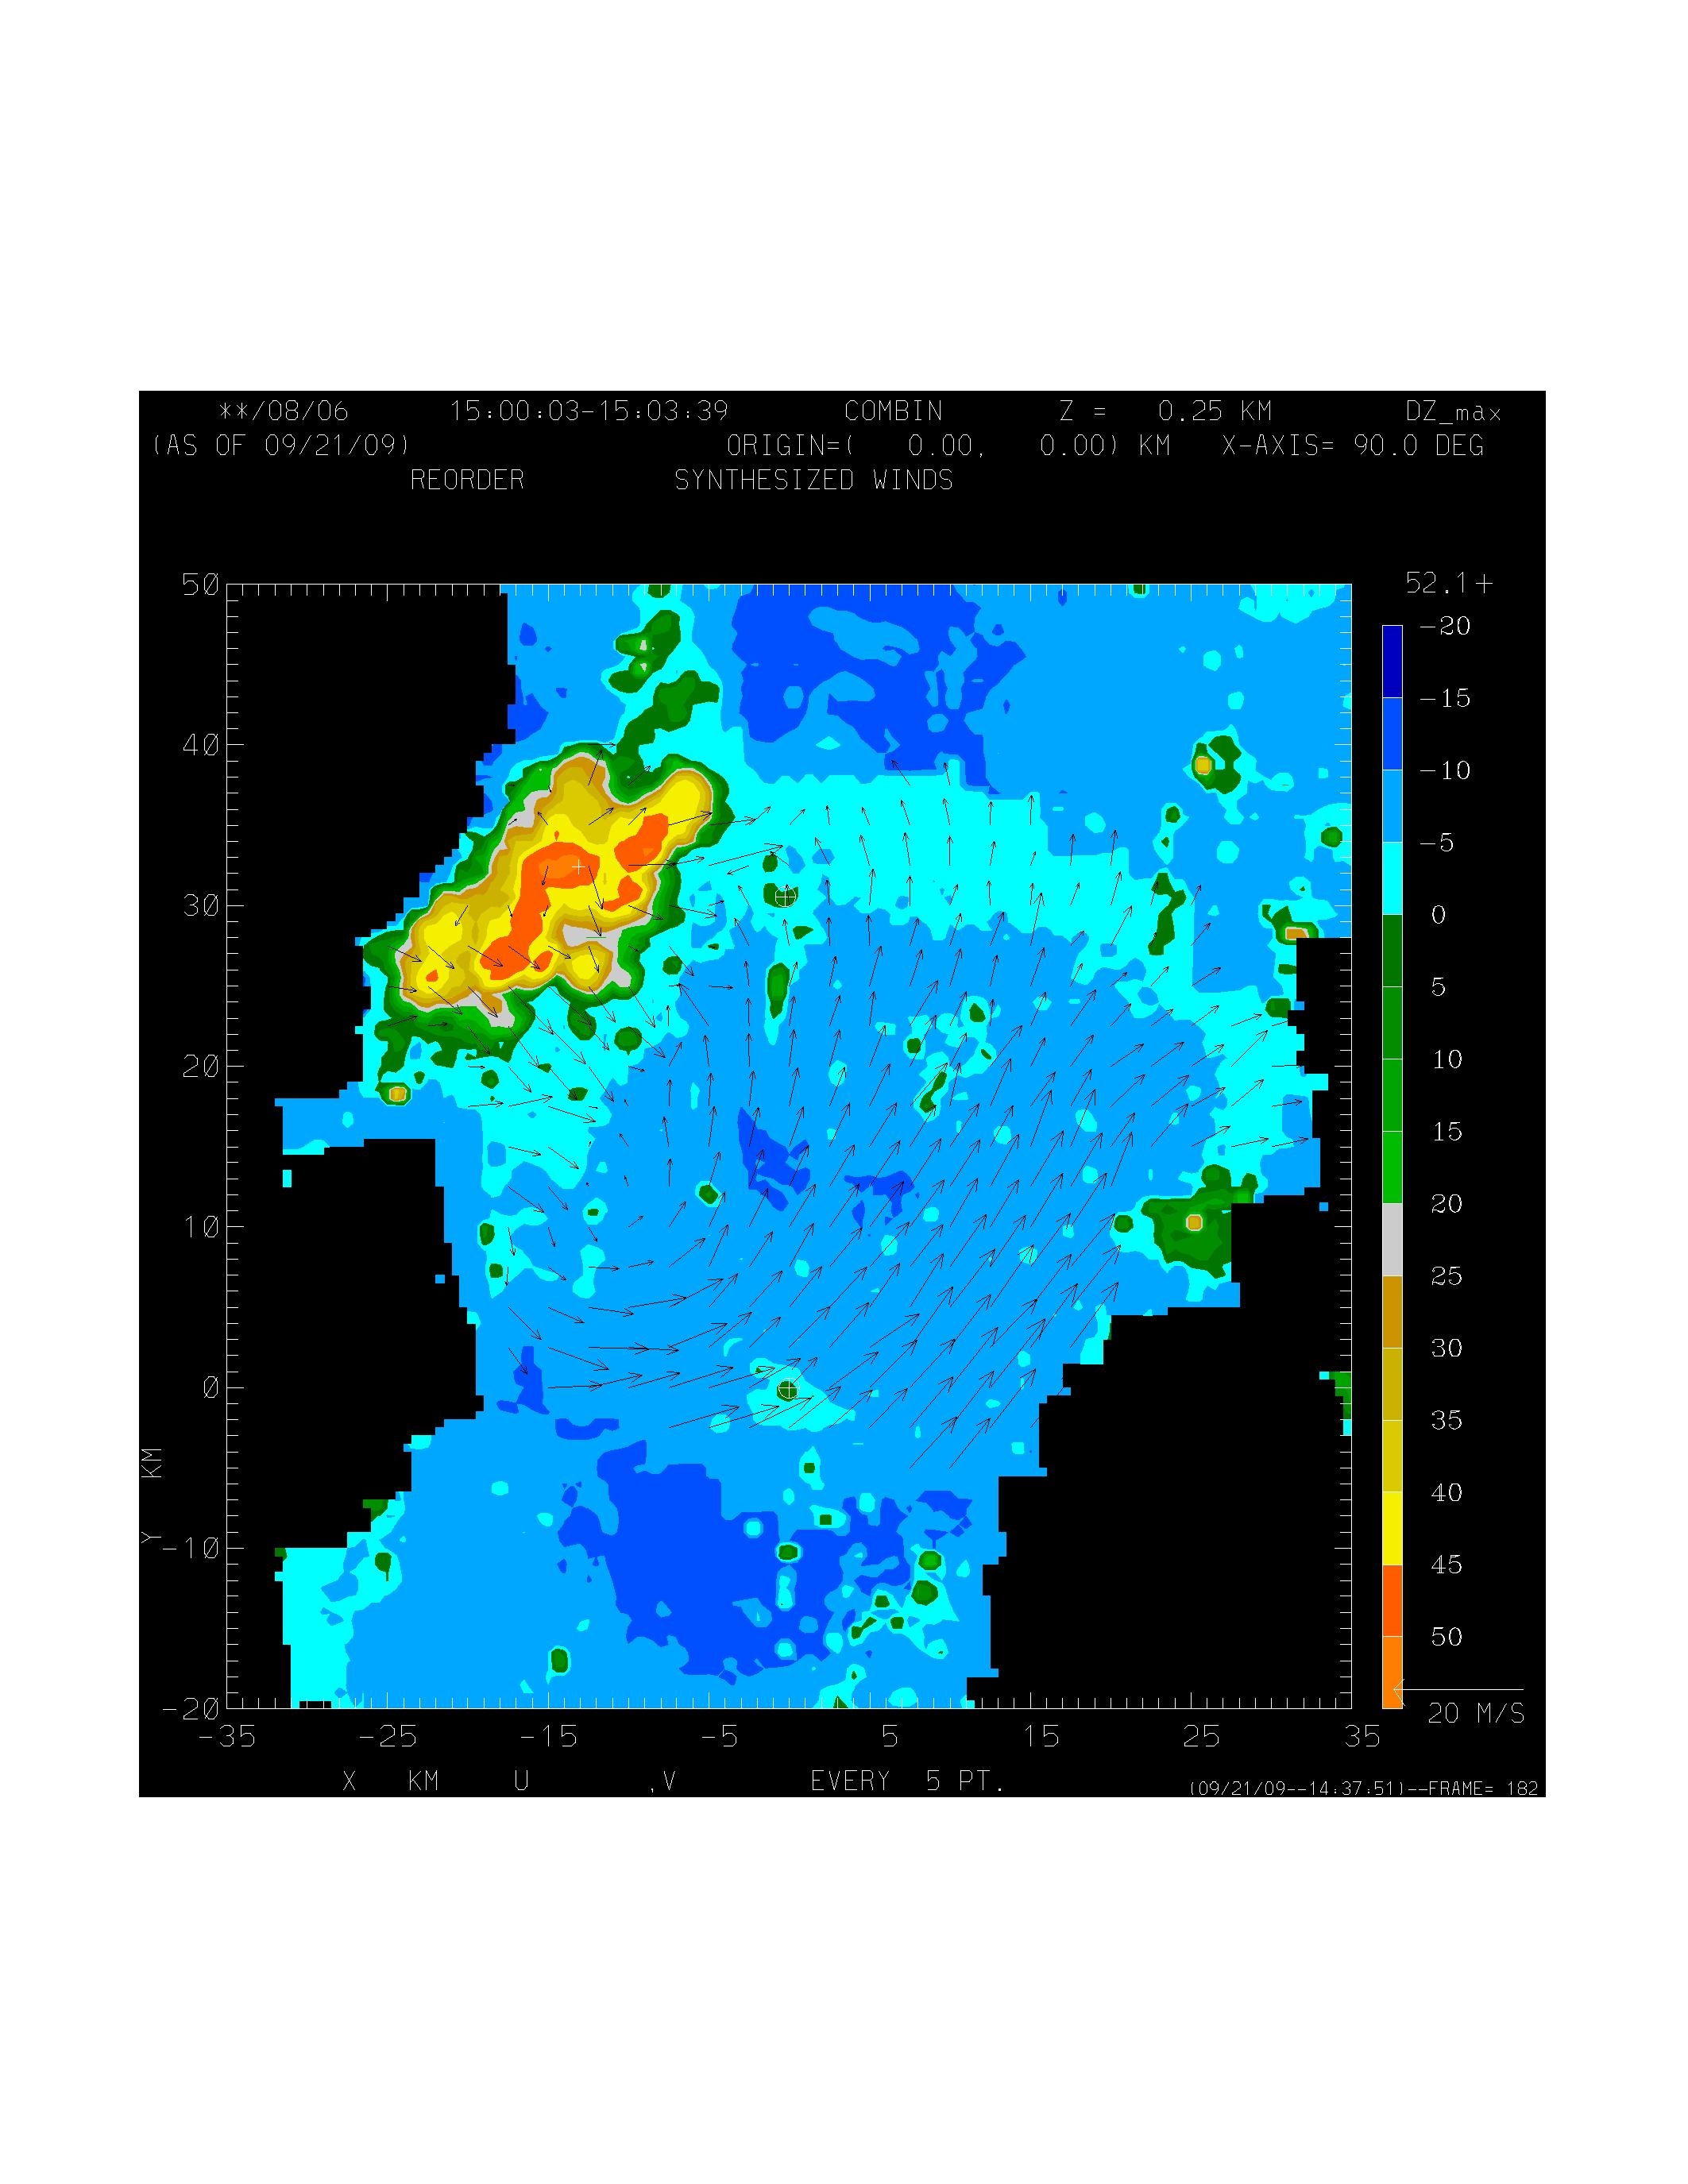
The DZ_max graphic is meant to be a test. I eventually want to add selected images showing the quality-control variables from Reorder such as the CNT and OCT fields. Also, I want to show the impact of varying the radii of influence in XYZ and RAE space. Further, I will present some guidance on a reasonable path that includes gridding with Reorder and filling (PATCHER) in Cedric. There is still much to do!
------------------------------------
This page includes the power point presentation (see Attachment under Tools) given by L. Jay Miller on September 22, 2009 along with several selected images illustrating various aspects of gridding and wind synthesis.
The separate parts of the complete run_cedsyn Cedric script:
- Part 1: run_cedsyn (BEGIN) - Basic framework for processing two single radar datasets, one for DOW2 and one for DOW3. The Reorder output files (HHMM-DOW2.ced and HHMM-DOW3.ced) were linked to Fortran units 71 and 72 with the "ln -sf" Linux command. Part 2 of the complete run_cedsyn Cedric script includes the DEFINE block (FIL_GRAF) that is EXPANDed twice, once for DOW2 and once for DOW3.
- Part 2: run_cedsyn (FIL_GRAF) - DEFINE block used to perform a series of Cedric operations including the reading (READVOL) of the input files linked to FortInp into a Cedric internal edit file, some deletion (DELETE) of fields that were gridded with Reorder and are not needed here, some renaming (RENAME) of fields, and some filling (PATCHER) of fields using a two-dimensional least-squares linear (FILLCON) method. All these operations are finally followed by the generation of graphics (uses NCAR graphics package) and the writing out (WRITVOL) of the individual radar datasets, one for DOW2 (FortOut=Fortran unit 81) and one for DOW3 (FortOut=Fortran unit 82).
- Part 3: run_cedsyn (SYNUVW) - DEFINE block used for the dual-Doppler (DOW2 and DOW3) wind synthesis, the creation of some additional fields, the graphing of results, and the writing (WRITVOL) of these computational results.
- Part 4: run_cedsyn (PATCHER) - Commands for additional filling (PATCHER) of fields.
- Part 5: run_cedsyn (Filter) - Commands for filtering and creating new fields.
- Part 6: run_cedsyn (COMPARE) - Commands for comparing input and output fields.
- Part 7: run_cedsyn (FINISH) - Commands finishing and writing the synthesis output.
- Display of DZ_max - A display of the DZ_max field using NCAR graphics