1. Introduction to the verification of the NCAR WRF-PME Real-Time Four Dimensional Data Assimilation system on saudi-c3
The verification system for the NCAR-PME WRF Real-time Four Dimensional Data Assimilation (PME_RTFDDA) system is built upon three main components: the Model Evaluation Tools (MET) verification toolkit, the METViewer database and display system, and the Rocoto job scheduling tool. MET is a freely available and open source set of highly-configurable verification tools. It consists of several command line utilities for evaluating the quality of the gridded numerical weather prediction forecast products. MET includes tools for pre-processing various forecast and observation datasets, comparing gridded forecasts to both gridded and point observations, and aggregating results across multiple cases. MET is used on the PME_RTFDDA verification system to evaluate the quality of many different forecast variables and levels by comparing them to both gridded (radar data) and point (surface and sounding data) observation datasets.
The METViewer database and display system extends the functionality of MET. The statistical output of the MET verification tools is loaded into a METViewer relational database. METViewer provides both interactive and automated batch processing options for visualizing those verification statistics. XML files are used to define one or more plot types to be generated. METViewer is used for the PME_RTFDDA verification to create automated plots for many of the forecast variables and levels evaluated by the MET tools.
The Rocoto job scheduling tool is used to automate the data ingest, verification with MET, and plotting with METViewer. Sets of logically related tasks are organized into workflows which are defined in an XML file. The various dependencies between those tasks are identified and defined within that XML workflow. Rocoto is run for each workflow every few minutes through the crontab. Each time Rocoto is run for a workflow, it queries the batch system (torque on saudi-c3) to determine the status of previously submitted jobs. After analyzing the job status and dependencies, if possible, it submits more tasks to the batch system and exits. By running Rocoto every few minutes, it efficiently progresses through the tasks and accomplishes the workflow. For the PME_RTFDDA verification system, Rocoto is used to run four workflows in real-time: three to handle the data ingest and preprocessing of external model data and one to run the MET verification tools.
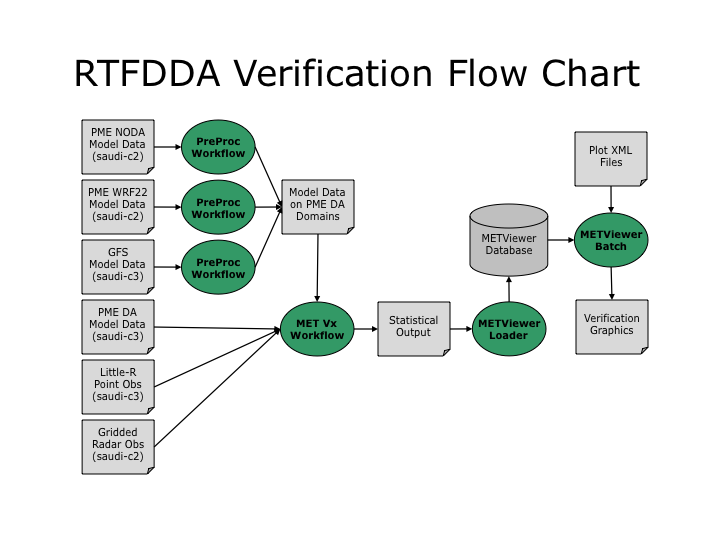
Figure 1. Schematic of the data ingest, verification, and plotting for the PME_RTFDDA system on saudi-c3.
2. MET Verification Workflow
The real-time MET Verification Workflow is defined by the XML file named PME_RTFDDA_Vx_2012_rt.xml. A Korn shell script (run_PME_RTFDDA_Vx_2012_rt.ksh) is run through the crontab every 5 minutes to execute this workflow through Rocoto. This following defines the logic implemented in this verification workflow.
- Directory Structure
- The home directory of the pmemet user contains several links to directories of interest:
- MET_releases contains the MET software build.
- metviewer contains the METViewer software build.
- bin contains the PERL and shell scripts called by the various workflows and crontab entries.
- config contains the configuration files used by the MET tools.
- fcst contains links to the forecast model data to be evaluated.
- obs contains the reformatted point observations and gridded radar observations.
- met_out contains the MET output for each combination of model name and saudi-c3 domain evaluated.
- log contains log files generated by the various workflows and crontab entries.
- plots contains verification plots generated by METViewer for weekly, monthly, and seasonal aggregations.
- xml contains XML files for defining the various workflows, loading data into the METViewer database, and generating METViewer plots.
- The home directory of the pmemet user contains several links to directories of interest:
- Model Names
- Four models are evaluated in this system over the saudi-c3 D02 and/or D03 domains. All external model data is interpolated to the D02 and/or D03 domains by model-specific pre-processing workflows:
- The GRIB output of the PME_RTFDDA system is evaluated hourly on its D02 and D03 domains. This model output is named PME_DA.
- The GRIB output for the D02 and D03 domains of the no-data-assimilation modelling system on saudi-c2 is interpolated to the saudi-c3 D02 domain. This model output is named PME_NODA_C2D02 and PME_NODA_C2D03, respectively.
- The GRIB output for the D01 domain of the 22-km deterministic workstation WRF on saudi-c2 is interpolated to the saudi-c3 D02 domain. This model output is named named PME_WRF22_C2D01.
- The GRIB output of the 1/4 degree GFS model is interpolated to the saudi-c3 D02 and D03 domains. This model output is named GFS.
- Four models are evaluated in this system over the saudi-c3 D02 and/or D03 domains. All external model data is interpolated to the D02 and/or D03 domains by model-specific pre-processing workflows:
- Timing Logic
- The verification workflow operates based on the valid time of the observations. For each valid time, it finds and evaluates all forecast products across multiple initializations that are valid at that time. For example, at 12Z it evaluates the 6-hour forecast from 06Z, the 12-hour forecast from 00Z, the 18-hour forecast from 18Z on the previous day, and so on. The workflow defines a new cycle every 6 hours at 02Z, 08Z, 14Z, and 20Z. For the PME_DA, PME_NODA, and PME_WRF22 models, it evaluates 6 time offsets for each cycle: -3, -4, -5, -6, -7, and -8 hours. For example, for the 20Z cycle, it evaluates those forecasts for valid times of 12Z, 13Z, 14Z, 15Z, 16Z, and 17Z. For the GFS model, it evaluates 2 time offsets for each cycle: -5 and -8 hours. For example, for the 20Z cycle, it evaluates GFS for valid times of 12Z and 15Z. The verification tasks described below is applied for each of these valid times.
- Workflow Tasks
- The verification workflow consists of a series of tasks to be executed in a particular order. Each task is defined in a PERL script, however submitting PERL scripts directly to the batch system is problematic. Instead, the call to each PERL script is wrapped in a Korn shell script named run_command.ksh. That Korn shell script simply executes the arguments passed to it on the command line. Therefore, each workflow task is a call to run_command.ksh with command line arguments indicating which PERL script should be executed.
- Reformat Little-R Point Observations
- Timing: Run once for each valid time to be evaluated.
- Dependencies: Depends on the existence of the ASCII Little-R file.
- Function: Call the rfmt_obs_little_r.pl PERL script to run the MET ascii2nc tool and reformat the Little-R point observation produced by the PME_RTFDDA system into a format the other MET tools can use.
- Reformat Gridded Radar Observations
- Timing: Run once for each valid time to be evaluated.
- Dependencies: Depends on the existence of the gridded radar data file.
- Function: Call rfmt_obs_radar.pl PERL script to run the copygb utility to regrid the radar data to the saudi-c3 D02 and D03 domains.
- Point Verification
- Timing: Run once for each combination of valid time, model name, and saudi-c3 domain to be evaluated.
- Dependencies: Depends on the existence of the forecast data file and the completion of the Little-R reformatting step above.
- Function: Call the met_point_verf.pl PERL script to run the MET point_stat tool to verify gridded forecast data against the reformatted Little-R point observations.
- Run point_stat once to verify surface fields against ADPSFC observations.
- Evaluate surface pressure, pressure reduced to mean sea level, 2-meter temperature, 2-meter relative humidity, 2-meter dewpoint, and 10-meter winds over the full model domain.
- Run point_stat a second time to compute matched pair output lines for individual stations of interest.
- Evaluate variables listed above for the stations falling within Saudi Arabia.
- For 12Z valid times, run point_stat a third time to verify the upper-air fields against ADPUPA observations.
- Evaluate height, temperature, relative humidity, dewpoint, and winds at 1000, 925, 850, 700, 500, 400, 300, 250, 200, and 150mb.
- Run point_stat once to verify surface fields against ADPSFC observations.
- Gridded Verification
- Timing: Run once for each combination of valid time, model name, and saudi-c3 domain to be evaluated.
- Dependencies: Depends on the existence of the forecast data file and the completion of the radar reformatting step above.
- Function: Call the met_grid_verf.pl PERL script to run the MET pcp_combine, grid_stat and mode tools to verify gridded forecast data against gridded radar observations.
- Run pcp_combine, if necessary, for each precipitation accumulation interval to be evaluated (1, 3, or 6-hour accumulations, as defined in bin/constants.proj)
- Run grid_stat to compute traditional statistics and neighborhood statistics over the full model domain.
- For the D02 domain, run grid_stat a second time to compute traditional verification statistics over each of the Saudi Arabian provinces.
- Run MODE twice using low and high object definition thresholds over the full model domain.
- Load METViewer
- Timing: Run once for each cycle.
- Dependencies: Depends on the completion of the gridded and point verification tasks for that cycle.
- Function: Call the metv_load_valid.pl PERL script to load the MET output generated for that cycle into the METViewer database.
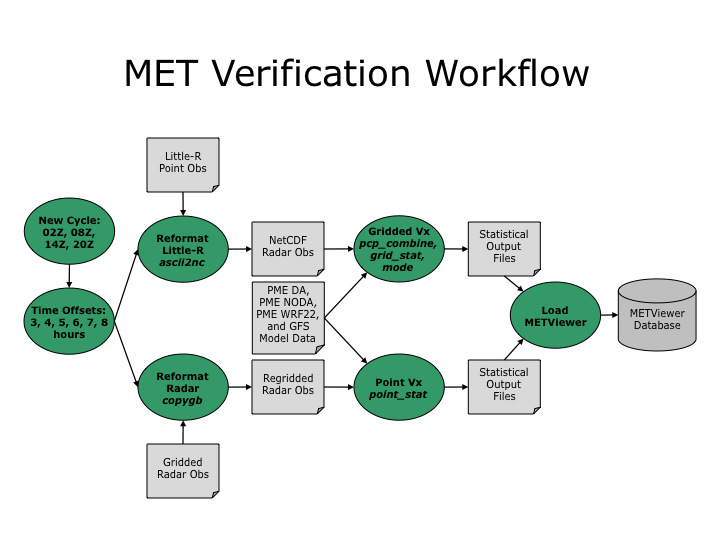
Figure 2. Schematic of the MET verification workflow for the PME-RTFDDA system on saudi-c3.
3. Verification Graphics
Verification graphics are generated four times per day at 00Z ,06Z, 12Z, and 18Z by calling the run_metv_plot_init.sh script through the crontab. For each run, plots are generated for the initialization 12 hours prior. For example, at 18Z plots are generated for 06Z model initializations. Automated plots are generated for three different time aggregations: the current week, the current month, and the current season over the full saudi-c3 D02 domain and for 30 individual stations within Saudi Arabia. Plots are generated for height, pressure reduced to mean sea level, relative humidity, temperature, wind speed, and accumulated precipitation at various vertical levels. Categorical statistics are plotted for 3 and 6-hour accumulated precipitation: critical success index, false alarm ratio, and the Gilbert Skill Score (i.e. equitable threat score). Continuous statistics are plotted for surface and upper-air variables: mean error, mean absolute error, root mean squared error, and bias-corrected root mean squared error. For each time aggregation (week, month, and season) and initialization hour (00Z, 06Z, 12Z, and 18Z), 262 plots are generated.
These automated plots are available for viewing at this website:
http://saudi-c3.rap.ucar.edu/projects/GWPME
METViewer also provides an interactive web GUI for creating custom plots of the data. The METViewer GUI is available at this website: