
Of course, I now think that many pressure spikes are now real events (e.g. dust devils). However, I've seen other spikes (mostly upwards) that aren't real. Further tracking finds that most are (only?) spikes in the Paro's temperature measurement. These spikes are always positive. During 10 Aug, most of these were with t.8b, however I also see them on 5b, 9b, 10b, 7t, and 8t. These are not exclusively on pressure2, nor are they all the channels on pressure2. Also, there is a pattern of most (but not all) spikes at night. I <think> these started in the last, narrow, configuration, but I'm not yet sure.
Since Paro t changes slowly (essentially a Tcase), it is trivial to despike these. However, despiking would best be applied upstream of Gordon's code to apply calibrations, and I think it would be a lot of work to redo this at the moment. (But it should be done before preparing the final data set.)
For the wide array, from Jun 26 to Jul 18, there is some confusion about the bottom level downwind sonic anemometers on towers 4, 5 and 6. The variable names from these sonics have suffixes of 4b, 5b and 6b, indicating what tower they were on.
Intended Configuration for 4b,5b,6b
The intended configuration for the sonics is as follows, along with the serial numbers that Kurt wrote in his setup notes:
location |
serial port |
sensor id |
serial number |
4b |
ttyS6 |
2040 |
744 |
|---|---|---|---|
5b |
ttyS7 |
2050 |
745 |
6b |
ttyS8 |
2060 |
376 |
The samples are archived with the sensor ids, so after the data has been sampled, knowing the relation between location and sensor id is critical, and is what needs to be determined for these sonics.
So far nothing has indicated any error in Kurt's setup notes of the relation between location and serial number.
The configuration of the later arrays also confirms Kurt's notes for the wide array, because when the sonics were moved to the medium and narrow arrays, care was taken to keep them in their respective locations.
Tom's documentation of the serial number/serial port relation for the medium spaced array, https://wiki.ucar.edu/x/OYWgAQ, agrees with the above serial port to serial number relation.
SteveO's entry for the narrow array, https://wiki.ucar.edu/x/W4CqAQ, also agrees with the above.
In setting up these arrays, care was presumably taken to get the cabling right, so that we're also confident of the mapping from serial port to location during those configurations.
Possible Cross-cabling in Wide Array
In log entry https://wiki.ucar.edu/x/tBR_AQ, Tom used rserial to record the sonic serial numbers at each serial port for the wide array, and noted the following results:
serial port |
serial number |
ttyS6 |
745 |
|---|---|
ttyS7 |
376 |
ttyS8 |
744 |
From this he concluded that the cabling from serial ports to the sonics was crossed up from the intended configuration.
The XML specifies what sensor id is assigned by the DSM to each sample received on a serial port. I believe the XML was checked at that time, and it contained the intended mapping from serial port to sensor id. So at that time it appeared that the actual relation between sensor id and location on the wide array was as follows:
location |
serial port |
sensor id |
serial number |
4b |
ttyS8 |
2060 |
744 |
|---|---|---|---|
5b |
ttyS6 |
2040 |
745 |
6b |
ttyS7 |
2050 |
376 |
If the above relation of sensor id to location was true, then our data processing, which used the intended configuration, assigned wrong location suffixes to the data from those sonics for the wide array.
Evidence of Actual Sonic Location
There are several counter-arguments to the above, indicating that Tom somehow confused the serial ports in his log message, and that the cabling matched the intended configuration in the wide array.
First, the serial number to sensor id relation can be read from the data archive, since the rserial output is archived. The serial number messages from the archive of the wide array are shown here, with their sample times:
date time UTC |
sensor id |
serial number |
2008 06 29 22:30:34.0640 |
2,2040 |
SN0744 |
|---|---|---|
2008 06 29 22:33:09.7736 |
2,2050 |
SN0745 |
2008 06 29 22:34:38.8956 |
2,2060 |
SN0376 |
Assuming Tom progressed through the serial ports in order, they show the serial number sequence to be 744, 745, 376, and not 745, 376, 744. The sensor ids are also in time order: 2040, 2050, 2060, and the mapping of sensor id to serial number matches the intended configuration, and not the crossed configuration.
Perhaps two mistakes were made which cancelled each other: cross-cabling, and the complement association between serial port and sensor id in the XML? Or perhaps the XML on the DSM was corrected to match the cabling shortly after the wide array started, and then corrected back for the medium spaced array? Both seem unlikely. The sequence of the above serial numbers suggest that neither of the above occurred, and that the serial ports were recorded incorrectly in Tom's log message.
The sensor ids have not been altered in the archive after it was recorded, since the modification times of the files have been preserved and match the original recording times.
Steve Oncley also looked at data during dust devil events from these sonics during the wide array, and the spacial continuity of the relative wind directions indicate that the sonics were in the intended configuration.
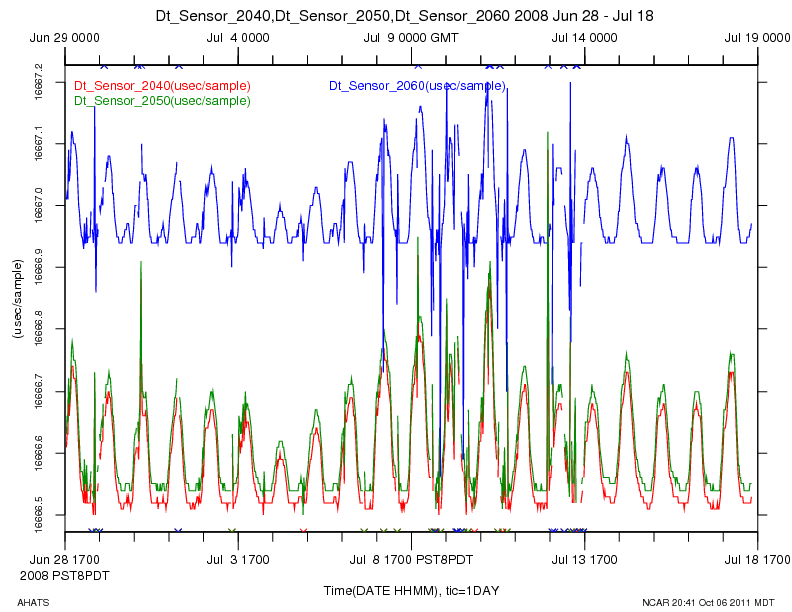
The tt_adjust program has been run on the AHATS unsorted raw data. One of the results of the processing is a linear fit of the relation of the sample time tag to the sample number, for every 1/2 hour. The slope of the fit is the sampling period of the sensor, which for sonics at 60Hz, should be about 16666.7 microseconds. Systematic differences between the sample periods of individual sonics can be seen, which provide another indication of the relation between the sensor id and the sonic serial numbers.
The sampling rates show a diurnal temperature dependence, but one can distinguish the individual sonics. Below is a plot of sample delta-T for sensor ids 2040, 2050 and 2060 for the entire project, showing that the serial number to sensor id mapping did not change for these sonics during the project. The sensor id is shown in the trace legend.
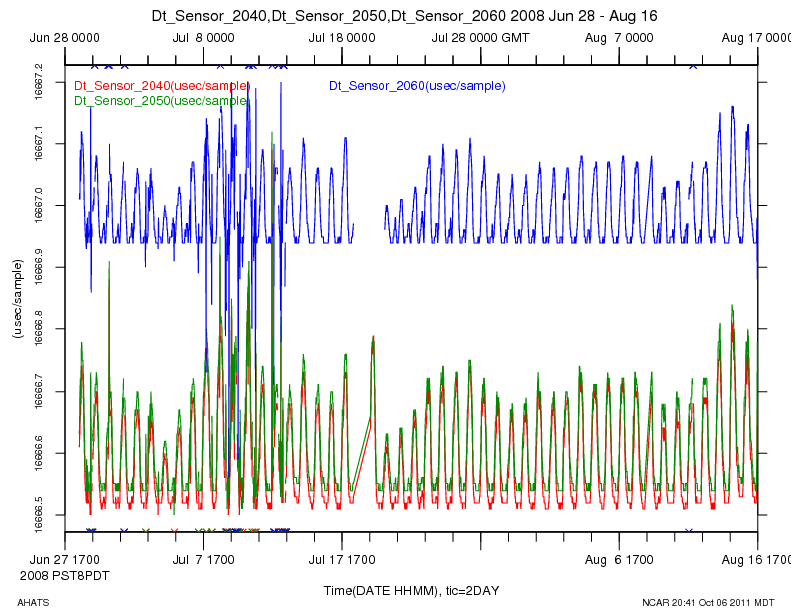
The data is a bit noisy during the wide array, but it seems quite certain that the relation of serial number to sensor id did not change:
Serial Number vs Sensor ID History
For all sonics connected to downwind1, here is the serial number information in the archive:
date time UTC |
sensor id |
serial number |
presumed location |
notes |
2008 06 29 21:43:30.5690 |
2,2010 |
SN0853 |
1b |
|
|---|---|---|---|---|
2008 06 29 21:44:06.8606 |
2,2010 |
SN0853 |
1b |
|
2008 06 29 21:49:02.5737 |
2,2020 |
SN1117 |
2b |
|
2008 06 29 21:52:02.6381 |
2,2020 |
SN1117 |
2b |
|
2008 06 29 21:53:49.3434 |
2,2030 |
SN0800 |
3b |
|
2008 06 29 22:30:34.0640 |
2,2040 |
SN0744 |
4b |
|
2008 06 29 22:33:09.7736 |
2,2050 |
SN0745 |
5b |
|
2008 06 29 22:34:38.8956 |
2,2060 |
SN0376 |
6b |
|
2008 06 29 22:36:25.1529 |
2,2010 |
SN0853 |
1b |
|
2008 06 29 22:37:50.2269 |
2,2020 |
SN1117 |
2b |
|
2008 06 29 22:38:16.8077 |
2,2030 |
SN0800 |
3b |
|
2008 06 29 22:46:31.9746 |
2,3030 |
SN0738 |
3t |
|
2008 06 29 22:48:33.8801 |
2,3040 |
SN0856 |
4t |
|
2008 06 29 22:49:30.2804 |
2,3050 |
SN0712 |
5t |
|
2008 06 29 22:50:11.3536 |
2,3060 |
SN0672 |
6t |
|
|
|
|
|
|
2008 07 19 18:59:35.9615 |
2,2010 |
SN0853 |
1b |
|
2008 07 19 19:01:06.9888 |
2,2030 |
SN0800 |
3b |
|
2008 07 19 19:03:07.5053 |
2,2040 |
SN0744 |
4b |
|
2008 07 19 19:04:48.1197 |
2,2050 |
SN0745 |
5b |
|
2008 07 19 19:07:07.0574 |
2,3030 |
SN0738 |
3t |
|
2008 07 19 19:09:16.3050 |
2,3030 |
SN0738 |
3t |
|
2008 07 19 19:10:44.4320 |
2,3040 |
SN0856 |
4t |
|
2008 07 19 19:11:40.2070 |
2,3050 |
SN0712 |
5t |
|
2008 07 19 23:22:39.9607 |
2,2020 |
SN0741 |
2b |
sonic was replaced |
2008 07 21 16:49:07.5003 |
2,2060 |
SN0376 |
6b |
|
2008 07 21 16:49:58.4540 |
2,3060 |
SN0672 |
6t |
|
|
|
|
|
|
2008 08 11 22:56:47.7955 |
2,2010 |
SN0853 |
1b |
|
2008 08 11 22:57:46.2450 |
2,2020 |
SN0741 |
2b |
|
2008 08 11 22:58:11.5836 |
2,2030 |
SN0800 |
3b |
|
2008 08 11 22:58:39.3355 |
2,2040 |
SN0744 |
4b |
|
2008 08 11 22:59:02.7667 |
2,2050 |
SN0745 |
5b |
|
2008 08 11 23:00:23.5102 |
2,2060 |
SN0376 |
6b |
|
2008 08 11 23:00:47.0487 |
2,3030 |
SN0738 |
3t |
|
2008 08 11 23:01:29.3204 |
2,3040 |
SN0856 |
4t |
|
2008 08 11 23:02:29.9896 |
2,3060 |
SN0672 |
6t |
|
Some of the boom_normal cal_files have values for Vazimuth for some configurations. This is inconsistent with most of the boom_normal files and the intent for boom_normal data. Consequently, I set those Vazimuths to 0.0.
Files changed:
-rw-rw-r-- 1 6072 Mar 16 12:01 csat_8m.dat
-rw-rw-r-- 1 6185 Mar 16 11:56 csat_8u.dat
-rw-rw-r-- 1 6532 Mar 16 11:54 csat_7u.dat
-rw-rw-r-- 1 6362 Mar 16 11:53 csat_6u.dat
-rw-rw-r-- 1 6388 Mar 16 11:52 csat_11t.dat
-rw-rw-r-- 1 6732 Mar 16 11:50 csat_6t.dat
-rw-rw-r-- 1 6351 Mar 16 11:46 csat_9b.dat
-rw-rw-r-- 1 6721 Mar 16 11:44 csat_6b.dat
-rw-rw-r-- 1 6385 Mar 16 11:42 csat_5b.dat
-rw-rw-r-- 1 6552 Mar 16 11:36 csat_2b.dat
-rw-rw-r-- 1 5258 Mar 16 11:35 csat_1b.dat
After correction of the sonic orientations using the sonic boom angles measured with the Data Scope, there were still systematic differences in the sonic wind directions across the arrays that were broadly correlated with the post-project sonic zero wind offsets measured in the wind tunnel. Therefore we subtracted offset corrections from the sonic horizontal wind components u and v.
The offsets were determined by assuming that the time-averaged wind field was uniform across each sonic array. First the mean values of the horizontal wind components were calculated for each sonic over the period of each configuration (or sub-configuration), only using data with wind directions within 45 degrees of normal to the array and wind speeds exceeding 1 m/s. The wind offset corrections were then derived by selecting one or more reference sonics in each array with small post-project-measured offsets. These were sonic 8u (s/n 0673) in the upwind array, sonic 6t (0672) in the top array, and sonics 4b (0744), 5b (0745) and 6b (0376) in the bottom array. The u and v offsets for each sonic were calculated as the differences between its mean values for u and v and the mean values for the corresponding reference sonic. To these offsets were added the wind-tunnel offsets measured for the reference sonics. Note that this procedure does not account for the variation of sonic wind offsets with temperature, but simply removes the mean offset irrespective of temperature.
u offsets (cm/s) for upwind arrays wrt CSAT 8u + 4.4 cm/sec
Sonic \ Config |
1.1* |
1.51* |
1.52* |
2 |
3 |
4 |
|---|---|---|---|---|---|---|
3u |
2 |
8 |
11 |
14 |
13 |
13 |
4u |
-5 |
-7 |
-3 |
-4 |
-1 |
-3 |
5u |
-7 |
-3 |
-2 |
-2 |
-2 |
-1 |
6u |
10 |
16 |
16 |
18 |
21 |
15 |
7u |
-2 |
-6 |
-7 |
0 |
0 |
-3 |
8u |
4 |
4 |
4 |
4 |
4 |
4 |
9u |
-7 |
-3 |
-4 |
-3 |
0 |
-3 |
10u |
2 |
6 |
0 |
-4 |
-8 |
-12 |
11u |
-9 |
-5 |
1 |
3 |
9 |
3 |
* Configuration 1 was divided into sub-periods because of its length and the expectation that the offsets may have changed with time.
Config 1.1: June 25 12:00 to July 1 12:17 (upwind height = 3.74m)
Config 1.51: July 1 12:55 to July l 9 09:25 (upwind height = 3.24m)
Config 1.52: July 9 09:25 to July 18 05:55 (upwind height = 3.24m)
v offsets (cm/s) for upwind arrays wrt CSAT 8u + 3.3 cm/sec
Sonic \ Config |
1.1 |
1.51 |
1.52 |
2 |
3 |
4 |
|---|---|---|---|---|---|---|
3u |
7 |
-3 |
3 |
17 |
18 |
18 |
4u |
3 |
-6 |
-7 |
2 |
-3 |
-4 |
5u |
6 |
-1 |
3 |
20 |
17 |
14 |
6u |
17 |
21 |
24 |
24 |
19 |
19 |
7u |
5 |
-3 |
-8 |
2 |
-11 |
-7 |
8u |
3 |
3 |
3 |
3 |
3 |
3 |
9u |
11 |
7 |
7 |
16 |
11 |
14 |
10u |
7 |
3 |
1 |
1 |
2 |
4 |
11u |
20 |
23 |
22 |
19 |
18 |
22 |
u offsets for top arrays wrt CSAT 6t + 2.3 cm/sec
Sonic \ Config |
1.2* |
1.6* |
2 |
3 |
4 |
|---|---|---|---|---|---|
3t |
1 |
-1 |
-7 |
-16 |
-11 |
4t |
1 |
7 |
12 |
14 |
13 |
5t |
-1 |
5 |
6 |
3 |
2 |
6t |
2 |
2 |
2 |
2 |
2 |
7t |
-1 |
4 |
4 |
3 |
3 |
8t |
2 |
4 |
5 |
10 |
6 |
9t |
2 |
4 |
9 |
13 |
9 |
10t |
7 |
10 |
9 |
13 |
10 |
11t |
5 |
11 |
17 |
13 |
12 |
* Config 1.2: June 25 12:00 to July 6 12:00
Config 1.6: July 6 12:00 to July l8 05:55
v offsets for top arrays wrt CSAT 6t + 2.2 cm/sec
Sonic \ Config |
1.2 |
1.6 |
2 |
3 |
4 |
|---|---|---|---|---|---|
3t |
7 |
11 |
10 |
5 |
15 |
4t |
7 |
6 |
14 |
10 |
6 |
5t |
-23 |
-26 |
-6 |
2 |
0 |
6t |
2 |
2 |
2 |
2 |
2 |
7t |
-9 |
-14 |
-15 |
-17 |
-19 |
8t |
10 |
12 |
-1 |
-4 |
3 |
9t |
3 |
4 |
0 |
7 |
3 |
10t |
5 |
4 |
-4 |
-4 |
-5 |
11t |
1 |
0 |
-3 |
-3 |
-5 |
u offsets for bottom arrays wrt CSAT 4,5,6b + 1.33 cm/sec
Sonic \ Config |
1.2 |
1.6 |
2 |
3 |
4 |
|---|---|---|---|---|---|
1b |
10 |
12 |
21 |
7 |
8 |
2b |
2 |
0 |
18 |
13 |
12 |
3b |
6 |
6 |
6 |
9 |
2 |
4b |
5 |
5 |
1 |
3 |
2 |
5b |
0 |
0 |
-2 |
-2 |
0 |
6b |
-1 |
-1 |
5 |
3 |
2 |
7b |
9 |
9 |
5 |
6 |
5 |
8b |
2 |
3 |
-4 |
-3 |
-4 |
9b |
-12 |
14 |
-13 |
-6 |
-6 |
10b |
2 |
1 |
-2 |
-4 |
-14 |
11b |
0 |
5 |
5 |
2 |
0 |
12b |
16 |
23 |
26 |
19 |
15 |
13B |
3 |
12 |
11 |
2 |
0 |
v offsets for bottom arrays wrt CSAT 4,5,6b + 0.67 cm/sec
Sonic \ Config |
1.2 |
1.6 |
2 |
3 |
4 |
|---|---|---|---|---|---|
1b |
14 |
18 |
13 |
23 |
25 |
2b |
4 |
-4 |
-1 |
-3 |
4 |
3b |
-3 |
-6 |
-16 |
-13 |
-10 |
4b |
-14 |
-16 |
1 |
3 |
-1 |
5b |
-16 |
-15 |
3 |
2 |
5 |
6b |
32 |
34 |
-2 |
-4 |
-2 |
7b |
-8 |
-9 |
-13 |
-10 |
-9 |
8b |
-4 |
-2 |
-6 |
-6 |
-2 |
9b |
-2 |
8 |
2 |
5 |
10 |
10b |
5 |
16 |
10 |
10 |
14 |
11b |
1 |
-2 |
-8 |
-11 |
-11 |
12b |
3 |
0 |
-3 |
-8 |
-8 |
13b |
1 |
-4 |
-14 |
-19 |
-2 |
We intend to estimate advection by taking the differences between data from the upwind sonic array and data from the downwind, bottom array. Therefore I have calculated the height difference between the sonic measurement volume and the nominal sonic heights measured at the base of the boom. The nominal heights were closely matched between the upwind and downwind arrays. I calculated the height difference as
sonic height above height measured at base of boom = boom-length*sin(pitch-angle) = boom-length*sin(lean*cos(leanaz))
where lean and leanaz were determined with the planar fit technique and recorded in the sonic cal files. The boom-length is the distance from the base of the boom to the sonic measurement volume = 1.765 cm.
In the following tables, a positive height difference indicates that the sonic is higher than the base of the boom. The height differences are in cm. The Date/time in the first column is when the new height difference takes effect.
Upwind array
Date/time (PDT) |
Config |
boom ht |
3u |
4u |
5u |
6u |
7u |
8u |
9u |
10u |
11u |
mean |
|---|---|---|---|---|---|---|---|---|---|---|---|---|
June 25 00:00 |
1 |
3.74 m |
1.7 |
-0.5 |
-2.4 |
-2.3 |
3.0 |
0.6 |
0.9 |
-1.0 |
-0.6 |
-0.1 |
July 1 13:00* |
1 |
3.24 |
1.0 |
-0.8 |
-3.3 |
-3.4 |
2.2 |
0.5 |
0.3 |
-2.1 |
-0.8 |
-0.7 |
July 20 16:00 |
2 |
3.64 |
0.4 |
6.1 |
0.4 |
3.0 |
4.0 |
3.1 |
1.5 |
0.2 |
-0.2 |
2.1 |
July 29 12:30 |
3 |
4.83 |
0.9 |
1.6 |
-3.3 |
1.5 |
1.8 |
1.2 |
2.5 |
2.2 |
0.2 |
1.0 |
Aug 9 18:00 |
4 |
6.98 |
6.1 |
7.7 |
7.3 |
4.1 |
4.1 |
7.7 |
2.8 |
4.6 |
1.1 |
5.0 |
* changed upwind array height from 3.74m to 3.24m
Bottom, downwind array
Date/time (PDT) |
Config |
boom ht |
1b |
2b |
3b |
4b |
5b |
6b |
7b |
8b |
9b |
10b |
11b |
12b |
13b |
mean |
|---|---|---|---|---|---|---|---|---|---|---|---|---|---|---|---|---|
June 25 00:00 |
1 |
3.24 m |
1.4 |
-0.2 |
-1.4 |
0.4 |
0.2 |
-2.7 |
-0.6 |
-4.0 |
2.4 |
1.0 |
-1.5 |
-1.3 |
0.9 |
-0.4 |
July 20 16:00 |
2 |
3.64 |
-1.8 |
-7.7 |
-11.4 |
-7.2 |
-4.8 |
2.2 |
-2.5 |
-7.9 |
-9.6 |
-10.7 |
-7.6 |
-1.3 |
-2.7 |
-5.6 |
July 29 12:30 |
3 |
4.83 |
-2.4 |
-8.7 |
-12.3 |
-8.4 |
-7.0 |
0.3 |
-4.2 |
-10.5 |
-11.2 |
-11.3 |
-7.9 |
-3.3 |
-0.5 |
-6.7 |
July 31 17:00* |
3 |
4.83 |
5.9 |
3.3 |
0.9 |
2.1 |
3.0 |
1.1 |
2.4 |
-1.4 |
0.3 |
-1.2 |
-1.8 |
-2.0 |
-0.5 |
0.9 |
Aug 9 18:00 |
4 |
6.98 |
5.4 |
3.5 |
2.5 |
2.4 |
3.0 |
1.9 |
2.9 |
2.4 |
3.1 |
-0.7 |
-0.4 |
1.0 |
3.1 |
2.3 |
* adjusted height of downwind array sonics to decrease boom sag
Top, downwind array
Date/time (PDT) |
Config |
Boom ht |
3t |
4t |
5t |
6t |
7t |
8t |
9t |
10t |
11t |
mean |
|---|---|---|---|---|---|---|---|---|---|---|---|---|
June 25 00:00 |
1 |
4.24 m |
-2.1 |
-0.9 |
-0.9 |
0.6 |
-0.6 |
-2.1 |
0.7 |
2.1 |
0.4 |
-0.3 |
July 20 16:00 |
2 |
4.64 |
-3.4 |
-2.9 |
-0.9 |
3.2 |
-3.3 |
-4.5 |
-5.4 |
-5.0 |
-4.6 |
-3.0 |
July 29 12:30 |
3 |
5.83 |
-4.4 |
-5.1 |
-3.1 |
0.6 |
-4.7 |
-6.9 |
-6.8 |
-5.7 |
-4.7 |
-4.5 |
July 31 17:00* |
3 |
5.83 |
2.6 |
0.8 |
0.3 |
2.1 |
2.2 |
5.8 |
7.2 |
4.3 |
3.5 |
3.2 |
Aug 9 18:00 |
4 |
7.98 |
3.8 |
2.5 |
3.5 |
2.6 |
2.0 |
2.1 |
3.6 |
3.1 |
4.6 |
3.1 |
* adjusted height of downwind array sonics to decrease boom sag
Profile sonics
Date/time (PDT) |
Config |
1.5m |
3m |
4m |
5.5m |
7m |
8m |
|
|---|---|---|---|---|---|---|---|---|
June 25 00:00 |
1 |
-1.1 |
-2.2 |
-1.0 |
-1.0 |
-0.7 |
1.0 |
|
July 20 16:00 |
2 |
-0.6 |
-2.7 |
-0.2 |
0.0 |
-0.8 |
0.9 |
|
July 29 12:30 |
3 |
0.2 |
-3.1 |
-0.5 |
-1.3 |
-1.5 |
0.6 |
|
Aug 3 09:00* |
3 |
0.2 |
-3.1 |
-0.5 |
-1.3 |
-1.5 |
-1.0 |
|
Aug 3 09:41** |
3 |
0.2 |
-3.1 |
-0.5 |
-1.3 |
0.2 |
-1.0 |
|
Aug 5 15:25* |
3 |
0.2 |
-3.1 |
-0.5 |
-1.3 |
1.4 |
-0.2 |
|
Aug 9 18:00 |
4 |
-0.8 |
-3.7 |
-2.3 |
-2.5 |
-1.4 |
0.3 |
|
Aug 11 12:15* |
4 |
-0.8 |
-3.7 |
-2.3 |
-2.5 |
-1.4 |
-2.1 |
|
* replaced 7m and/or 8m sonics
** moved 7m sonic up
Steve Oncley and I are reviewing the measurement of sensor heights with the goal of perhaps reconciling ambiguities in the sensor heights.
The horizontal arrays sonic heights were measured relative to the mean of the heights agl of the reference marks for both the upwind (1.534 m) and downwind (1.53 m) arrays. The profile heights appear to have been measured relative to the height of the reference mark on the profile towere (1.52 m).
The reference mark height for all configuration 2 sensor heights was measured at the NE tower of the downwind horizontal array (goalposts) = 1.76m. Sonic 1b at the NE end of the array was 1.91m+0.05m = 1.96 m above the reference mark and sonic 12b at the SW end of the array was 1.92m+0.05m = 1.97 m above the reference. Sonic spacing was 1.29 m.
The mean heights above the reference mark of the upwind sonics was 1.92m+0.05m = 1.97 m. The heights agl of the upwind reference marks or the profile reference marks do not appear to have been measured. Assuming a reference height of 1.76m for the horizontal arrays, gives array heights of 1.76m+1.97m = 3.73m agl
Following are the new profile sensor heights.
nominal |
sonic* |
+1.76+0.053m |
+1.68+0.053** |
SHT* |
+1.76-0.37m |
+1.68-0.37m** |
|---|---|---|---|---|---|---|
3m |
1.96m |
3.77m |
3.69m |
2.36m |
3.75m |
3.67m |
4m |
2.90m |
4.71m |
4.63m |
3.33m |
4.72m |
4.64m |
5.5m |
3.99m |
5.80m |
5.72m |
4.43m |
5.82m |
5.74m |
* heights above configuration 2 reference mark
**corrected reference mark height implied by continuity of 3m profile sensors through configurations 2-4 (see Discussion at end).
The reference mark height for configuration 3 was not measured agl, but was measured to be 15.2 cm below the reference mark for configuration 2 or 1.76m-0.15m = 1.61 m. (BUT the height of the configuration 3 reference mark on the profile tower was later measured to be either 1.51m or 1.53m!) The heights of the downwind array sonic booms above the reference mark were measured to be
5b |
6t(?) |
6b |
12b |
|---|---|---|---|
3.254m |
3.252m (?) |
3.250m |
3.275m |
These heights were measured again on Aug 4 :
1b |
5b |
5t |
7b |
7t |
11b |
11t |
|---|---|---|---|---|---|---|
3.263 |
3.262 |
4.260 |
3.261 |
4.264 |
3.262 |
4.264 |
for mean sonic heights of 3.262m+1.61m+0.053m = 4.93 m and 5.93 m agl. The heights of the upwind sonics appear to be 3.254m+0.053m+1.61m = 4.92 m agl.
The profile sonic (?) heights were measured on Aug 3 :
|
8/3/08 boom hts* |
+1.61m +0.05m |
+1.51m +0.05m |
+1.53m +0.05m |
|---|---|---|---|---|
8m |
6.468m |
8.13m |
8.03m |
8.05m |
7m |
5.544m |
7.20m |
7.10m |
7.12m |
5.8m |
4.256m |
5.92m |
5.82m |
5.84m |
4.8m |
3.316m |
4.98m |
4.88m |
4.90m |
3.3m |
2.110m |
3.77m |
3.66m |
3.68m |
1.5m |
-0.026m |
1.63m |
1.53m |
1.55m |
There are several statements about the heights of the reference marks in this logbook entry. It is stated that the profile reference mark for configuration 3 = 1.505 m agl, but also that it is 0.027 m "above top of 1.55m sonic" (boom?), implying a height of 1.50m+0.027m = 1.53 m agl. Then it says the reference mark for configuration 4 is 0.040 m above the reference mark for configuration 3, which could be 1.65m, 1.55m or 1.57m agl.
The 1b sonic boom was measured to be 5.37m above the reference mark for configuration 4.
This logbook entry also measures the sonic and SHT heights wrt the 1.55m sonic boom. Note that these heights were not changed between configurations 3 and 4, and are consistent within 1cm of the last column of the preceding table.
nominal ht |
sonic* |
+1.55m |
SHT* |
+1.55m-0.42m |
|---|---|---|---|---|
8m |
6.508m |
8.06m |
6.878 |
8.01 |
7m |
5.582m |
7.13m |
5.886m |
7.02m |
5.5m |
4.286m |
5.84m |
4.710m |
5.84m |
4m |
3.352m |
4.90m |
3.749m |
4.88m |
3m |
2.140m |
3.69m |
2.542m |
3.67m |
1.5m |
0.0m |
1.55m |
0.376m |
1.51m |
- measured wrt the 1.5m sonic boom (at 1.50m agl )
Discussion
The 3m profile sensors were not moved through configurations 2-4, so that a discrepancy remains between the heights of the 3m profile sensors during configuration 2 (sonic:=3.77m and SHT=3.75m) and those for configurations 3 and 4 (sonic=3.69m and SHT=3.67m). This implies that the reference mark height for configuration 2, measured at the NE horizontal array tower to be 1.76m, did not apply at the profile tower, but should rather have been 1.68m. (Note that simple transposing the last two digits of 1.76m gives 1.67m, which is within 1 cm of the implied value.) Kurt very carefully kept the baseplates of the 6 towers for the horizontal array at the same elevation using a 4' carpenters level and presumably did the same for the profile tower. It seems unlikely that there was an 8 cm difference between the elevations of the 7 AHATS Roan towers. Assuming 1.67m for the height of the reference mark for configuration 2 gives the following heights:
|
Sonic 1 |
SHT 1 |
|
Sonic 2 |
SHT 2 |
|
Sonic 3 |
SHT 3 |
|
Sonic 4 |
SHT 4 |
|---|---|---|---|---|---|---|---|---|---|---|---|
reference ht |
1.52m |
1.52m |
|
1.67m |
1.67m |
|
1.52m |
1.52m |
|
1.56m |
1.56m |
upwind |
3.74/3.24 |
na |
|
3.64 |
na |
|
|
na |
|
6.98 |
na |
top |
4.24 |
na |
|
4.64 |
na |
|
5.83 |
na |
|
7.98 |
na |
bottom |
3.24 |
na |
|
3.64 |
na |
|
4.83 |
na |
|
6.98 |
na |
8m |
8.05 |
8.01 |
|
unch |
unch |
|
8.04 |
8.01** |
|
8.06 |
8.01 |
7m |
7.08 |
7.01 |
|
unch |
unch |
|
7.12 * |
7.02** |
|
7.13 |
7.02 |
5.5m |
5.53 |
5.47 |
|
5.71 |
5.73 |
|
5.83 |
5.84** |
|
5.84 |
5.84 |
4m |
4.24 |
4.23 |
|
4.62 |
4.63 |
|
4.89 |
4.88** |
|
4.90 |
4.88 |
3m |
3.30 |
3.26 |
|
3.68 |
3.66 |
|
3.68 |
3.67** |
|
3.69 |
3.67 |
1.5m |
1.55 |
1.51 |
|
unch |
unch |
|
1.55 |
1.51** |
|
1.55 |
1.51 |
unch: Profile heights not measured for configuration 2, but same as configuration 1
Height changed for profile sensors at start of configuration
* 7m sonic moved up on Aug 3 at 09:41
** The configuration 3 SHT heights were not measured, but copied from configuration 4
Following are the profile sonic boom angles measured for the four configurations.
Sonic |
Cnfg 1 |
cal |
|
Cnfg 2 |
cal |
|
Cnfg 3a |
Cnfg 3b |
cal |
|
Cnfg4 |
cal |
|---|---|---|---|---|---|---|---|---|---|---|---|---|
|
twh |
|
|
srs |
|
|
spo |
jm |
|
|
spo |
|
|
july 6-14 |
|
|
july 28 |
|
|
aug 1 |
aug 6 |
|
|
aug 12 |
|
1.5 m |
132.3 |
0.6 |
|
131.6 |
-0.1 |
|
135.1 |
132.4 |
0.7 |
|
132.3 |
0.6 |
3 m |
136.0 |
4.3 |
|
132.5* |
0.8 |
|
137.0 |
134.2 |
2.5 |
|
133.1 |
1.4 |
4 m |
133.6 |
1.9 |
|
129.8* |
-1.9 |
|
136.1* |
132.5* |
0.8 |
|
131.8 |
0.1 |
5.5 m |
134.6 |
2.9 |
|
133.7* |
2.0 |
|
138.2* |
134.8* |
3.1 |
|
133.4 |
1.7 |
7 m |
134.0 |
2.3 |
|
132.2 |
0.5 |
|
136.2* |
134.4*# |
2.7 |
|
133.8 |
2.1 |
8m |
132.6 |
0.9 |
|
133.7 |
2.0 |
|
137.0 |
133.0# |
1.3 |
|
134.3# |
2.6 |
*: sonic height changed from previous configuration
#: changed sonic since previous azimuth measurement
cal: azimuth entry in calibration file = measured magnetic azimuth - 131.7
For configuration 3, the 3b azimuths are more consistent with previous and
following azimuths than are 3a. I (twh) used 3b for the profile cal_files.
Both Semmer and Oncley measured azimuths for the horizontal arrays in configuration
2, and Militzer and Oncley measured azimuths for the horizontal arrays in
configuration 3. In both cases, Oncley's azimuth measurements were ~4 degrees
larger than the others. Thus we will use Semmer's azimuths for configuration2
and militzer's for configuration 3 . Also oncley recommends using the 'surveyed'
horizontal array azimuths for configuration 4, which in this case are mostly very close to Oncley's measurements.
I just set up a test with the digital theodolite in the far east parking lot. I chose to shoot SN0853, which had been used as "1b" in AHATS. In Tom/Rudy's plots, this shows a mean wind direction anomaly of about 4 degrees.
I set the sonic up on the TRAM tower, facing the gate.
I set the theodolite up near the gate (about 34m according to GoogleEarth).
For my reference heading, I shot a recognizable tree on the Olde Stage ridgeline (about 6km away). I moved the theodolite generally along the bearing to this tree, say within 10cm, so this reference heading should be good to atan(0.1/6000) = 3.5" of arc.
The array obviously was not exactly square, so I shot it three different ways, to be more-or-less representative of the variations that might be used.
Shooting the "u" transducer pair, I got 94d 38' 35" for the relative angle to the tree.
Shooting the top tube, I got 94d 43' 49" (essentially the same as the transducer pair).
Shooting the center of the bottom "u" transducer 90degree bend with the bracket at the bottom of the vertical strut, I got 93d 55' 39" -- just 0.7degree different.
Thus, I conclude that, although the array is not perfect, the magnitude of the geometry variations are less than 1 degree, which cannot explain the 4 degree differences that were observed in the field.
Laboratory checks of sonic S/N 0364 found "cycle slip" at temperatures below 20 C, in particular a temperature jump of about 1 deg C in path a around 16-18 deg C. (Other jumps occurred below 10 deg C, and thus at temperatures not attained during AHATS.) The temperature jump was an increase of about 1.8 deg C as temperature decreased and thus the sonic temperature would change by 0.6 deg C, since all three paths are averaged to give the output temperature.
I plotted the sonic temperature difference (sonic 8b - sonic 7b) versus sonic 7b temperature (5-minute covars) for the four AHATS configurations. Between 15 and 20 deg C, the temperature difference between the two sonics ranged from 0.2 to 0.4 deg C and I could not detect any systematic discontinuity in the plots, much less a temperature discontinuity of 0.6 deg C.
Here is the (designed) layout of all the towers. As built, the array was a mirror image of this, with the wide spacing towers to the West. Also, the upwind, non-staggered line of towers (in the medium spacing) was at the closer position of 5.12m upwind, rather than ~7m upwind that we had as an option in this design. 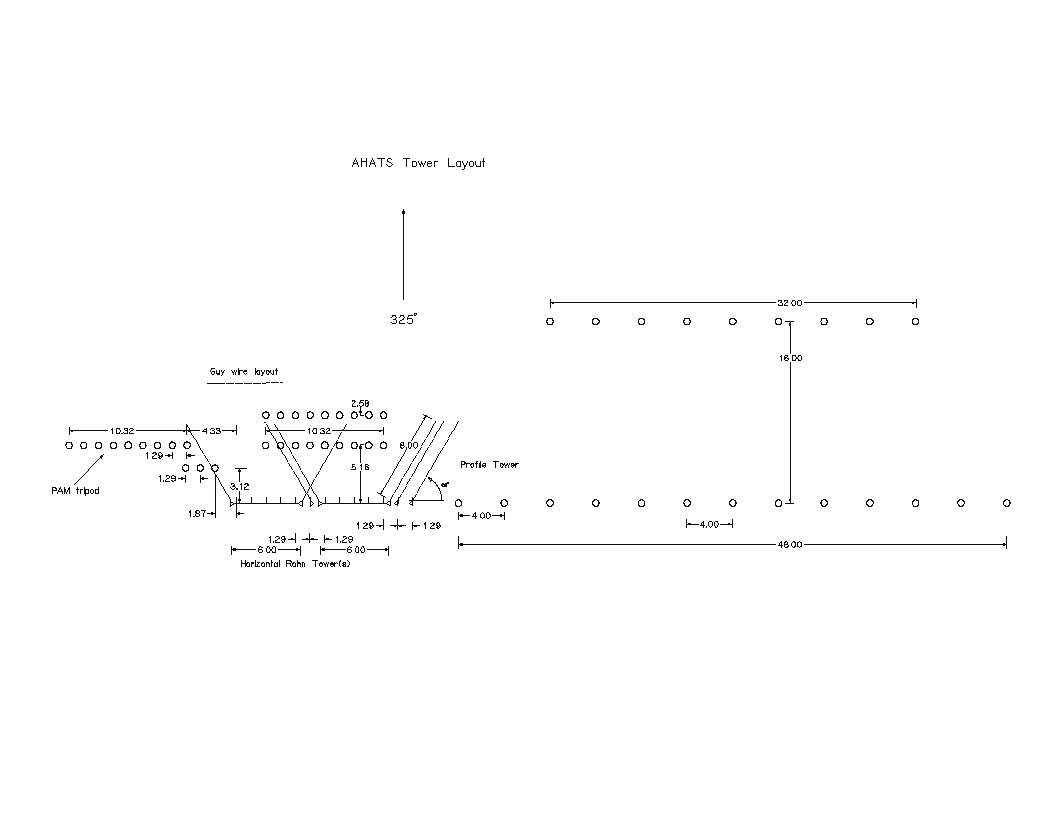
Today I finished a first edit of the AHATS sonic data, putting NA's in the cal_files when the 5-minute averages of the sonic diagnostic variable exceeded ~0.5. During the first configuration, these usually occurred simultaneously on all channels of one of the four sonic adams, suggesting that the adam could not keep up with data ingest when there were transmission problems back to the base. After the first configuration, simultaneous problems on all channels of an adam occurred less frequently and with smaller 'diag' values. Then most of the high 'diag' values were associated with the beginning or end of a period of lost data.
For configuration 4, after August 8, sonic 6u had recurring continuous periods in the middle of the day with 'diag' values between 0.05 and 0.1. I did not edity these out because it would have removed a significant fraction of the data from 6u during configuration 4.
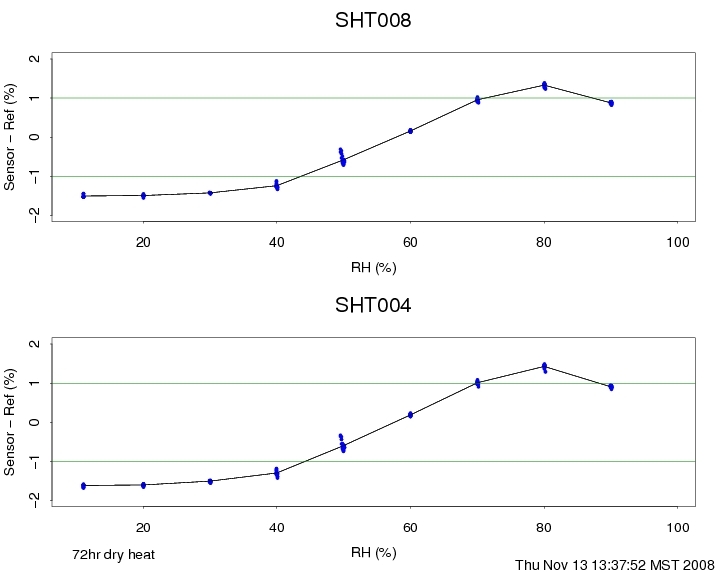
Post cals were conducted on the SHT probes. Temperature results were within +/- 0.1C. All sensors were within .05C except for sensors SHT001 (error: -.08C) and SHT006 (error: .07C). The humidity is a different story. Over the range of 10% to 90% the average error for all the sensors went from 1% to -8%. The figure below is an example. There was no obvious reason for the change in the calibration. One possibilty is the fine dust at the AHATS site.

A set of tests were conducted to try and restore the sensors. This was based on information from Sensirion. Two sensors were cleaned with distilled water then baked for 24 hours at 90C. The sensors were then run in the humidity chamber at 25C, 90% for 48 hours. This reduced the error to about -4% at 90%. A second test was conducted using a sonic cleaner before the baking test. This thought was the fine dust was imbedded in the sensor. The results were similar to the previous test. The third test was to similar to the first one except that the sensors were baked at 90C for 72 hours then put in the humidity chamber at 25C, 90 %. The figure below shows the result from this test. Based on this result we will perform the same procedure on the remaining sensors and hope to have similar results. Unfortunately there is no way to determine when the sensors started going bad.
FINAL AHATS status 8/16/08
TEARDOWN BEGINS NOW
Staff: Chenning, Militzer, Nguyen, Verstraete with ISS.
Temps: 105F/67F yesterday, for period 8/14 8:00 - 8/15 8:00
FINAL Good wind direction:
array#4 (aug 9 20:00 - Aug16 08PDT) has 39.5 hours (10.5 unstable, 29 stable).
Local data storage:
------------------
Filesystem 1K-blocks Used Available Use% Mounted on
upwind:/dev/sda1 57685532 7714060 49971472 13% /var/tmp/usbdisk
downwind1:/dev/sda1 57685532 16330816 41354716 28% /var/tmp/usbdisk
downwind2:/dev/sda1 57685532 17895232 39790300 31% /var/tmp/usbdisk
profile:/dev/sda1 57685532 11617692 46067840 20% /var/tmp/usbdisk
pressure1:/dev/sda1 3940812 1812112 2128700 46% /var/tmp/usbdisk
pressure2:/dev/sda1 3940812 1737824 2202988 44% /var/tmp/usbdisk
aster:/dev/sdb1 721075720 489152132 231923588 68% /media/isff2
isff: /dev/sdb1 1922890480 669008640 1156204636 37% /media/isff15
All systems had remained up and operational and performing basically the same as since the last daily status.
-See Also: boom azimuths for array4. I'll be adding the 'triginometric measured angles' to that log entry soon....
Aug14, 08:00 - 14:20
Pressure2's dsm wasn't recording/ingesting data. The adam itself was running. System and adam logs do not show any indication of an event at that time. I was in the middle of daily status at that point and it had been running when I arrived. Around 9:30 I went to the array for some azimuth measurements and failed to catch the problem before going out. 'adn' / 'aup' restarted daq. Unclear why it died. I had not logged on, or anything other than 'ds' and 'lsu' on aster according to the /var/log/isff at ~7:54