A post cal was done on the kryptons used in METCRAXII. They were checked over a range of 1 g/m^3 to 9 g/m^3.
Results below:
| Post Krypton cal: Sensor - Ref (g/m^3) | ||||
|---|---|---|---|---|
| sensor | min | mean | max | |
| 1101 | 3.280 | 3.608 | 4.012 | |
| 1392 | 2.544 | 2.733 | 2.975 | |
| 1394 | 1.798 | 1.929 | 2.070 | |
| 1525 | 3.353 | 3.636 | 4.000 | |
Here are the CPU numbers and emerald cards at the METCRAX sites:
| name | cpu | emerald |
|---|---|---|
| floor | titan #6 | 8P W329991 |
| rim | titan #2 | 8P W423565 8P W423626 |
| rimup | viper #13 | 8P W329987 |
| base | viper #6 | 8M W250043 |
| near | viper #4 | 8P W423623 8M W249924 |
| nearup | viper #9 | 8P W274177 |
| far | viper #16 | 8P W329990 |
The following directory was added: /net/isf/isff/projects/METCRAXII/doc/MOTE_Statistics
Under that are 3 more directories: ./farStatistics, ./flrStatistics, ./nearStatistics
Each directory contains a listing of the comment messages, and the serial number messages sent by the motes from respective locations. The extracted messages are generated by /net/isf/isff/src/wisard_code/wisardMessageDecoder program, and there is a shell script to 'extract' them generated by listing the files found in the raw_data repository. If you are wondering what mote sensors were attached at a particular date, check the 'sn' file.
Each directory also contains a 'raw-data-file by raw-data-file' listing of the mote message recovery statistics for each site/motes. The statistics are generated by /net/isf/isff/src/wisard_code/wisardMessageStatistics program, and there are shell scripts for that per raw_data files as well. The results files contain and explanation of how the statistics are generated. NOTE: this program does not look at the sensor data itself, only the raw message recovery: ie if a proper mote message is received (prefix, eom, correct-crc) it is counted as good. Good include 'power-messages' which were sent every 1min, and supercede data; ie. 11 of 12 messages are sensor data 1 of 12 power. Recovery percentage is calculated assuming that each 8 hour file should have 'data-rate'/28800(sec) messages: ie 5760 for data motes and 2880 for power motes.
Here's are summary of the 'readme' files.
Site |
Motes on Site |
Summary Message Recovery% |
GPS recorded by mote |
|
|
|
|---|---|---|---|---|---|---|
FAR |
ID2 = Power Monitor |
ID2 99.5% Power Mote |
ID16 3458.0021,N 11103.1736W |
|
|
|
FLR |
ID1 = SPN1-RAD |
ID1 81.0% SPN1 |
ID1 3501.678,N 11101.353W |
|
|
|
NEAR |
ID8 = RAD |
ID3 90.4% Soil |
ID3 3500.654,N 11102.260W |
|
|
|
FLOOR NOTE: Flr recovery with xbee's in the early part of the project was worse than shown (see list).
The averages shown above include bunches of 100% data points for 8hour files after
Steve Oncley interfaced them using serial cables (on 10/17?). It is unknown where the fixes
that recovered the xbee's (ie xr=0) at far/near would have been as successful in the crater.
NEAR NOTE: ID10 had redundant motes from 10/1-16; 1=SPN1 plus the 2nd=PwrMonitor
The average shown for ID10 takes the counts total from 10/1-16 and removed an assumed 100%
data recovery for the power monitor mote. This can be seen in the associated excel spreadsheet
GPS NOTE: Some Location were obtained for the few hours that they were enabled on the motes.
The gps' were turned off to save power and prevent those messages 'clogging' the comm. channel
Without gps/time-keeping, the local data storage is worthless so that too was not used preventing
recovery of message outages. Also Power Monitor motes don't have gps.
PWRMONITOR MOTES: Operated throughout the project without a reset, based upon their internal
data/time incrementing without interruption. They were interfaced serially and 'outages' were probably dsm?
RECOVERY STATS NOTES:
Note: Data is calculated from wisardMessageStatistics and averaged for '8hour' files encountered
Note: Data recovery = #good-messages / #5secMessagesExpected (ie 5/8*60*60=28800),
dsm outages also reduce the recovery whether the mote continued working or not.
Note: Calculations do not evaluate sensor data quality! Bad data in 'good messages' are not accounted for.
Note: #good = includes power measurements which were reported every 1min, and takes place of sensor data
Nov 6, twh:
The down-facing pyrgeometer thermopile at FAR failed intermittently during the project. It was essentially flat-lined from 09:10, October 7, until 17:25, October 12. It appeared to be fixed by opening it up and disconnecting and reconnecting to wires from the radiometer to the embedded microprocessor board. However it flat-lined again from 17:00, October 13, through 15:10, October 15. This time we noticed that a bit of solder may have unintentionally grounded one side of the thermopile. After cleaning this up, the pyrgeometer worked fine through the remainder of the project.
The data during these two periods have been deleted in post-processing. The periods were determined from a time-series plot of Rpile.out.far, as well as an xy-plot of Rlw.out.far vs Rlw.out.near. The periods estimated from the time-series plot were nearly identical those determined by selecting data from the residuals of a linear fit of Rlw.out.far vs Rlw.out.near. The bad data were selected when the absolute value of the residuals exceeded 17 W/m^2. See attached plot.


Again, using my phone:
Near tower: 35d 00.661' 111d 02.282'
Near location |
Latitude |
Longitude |
DOP |
|---|---|---|---|
Tower |
35d 00.661' |
111d 02.282' |
5m |
Rad Stand |
35d 00.650' |
111d 02.263' |
5m |
Soil plot |
35d 00.653' |
111d 02.260' |
5m |
November 4, twh.
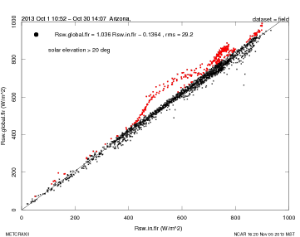
The FLR radiometers were not cleaned as often at the radiometers outside the crater and the upfacing pyranometer had periods of several days when it was contaminated with bird droppings while the SPN1 reportedly was not. The question arises, how well did the SPN1 measure global incoming shortwave radiation?
I begin with a comparison of the SPN1 global radiation to Rsw.in from the K&Z CM21 at NEAR.
I need a latitude and longitude for editing the solar radiation data by sun angle.
Cannot currently access the GPS lat/lon, so use those measured by Oncley at the end of the project. This is not all that critical for FLR and NEAR.
For the FLR radiation stand, SPO measured
latitude = 35d 01.680' = 35.028
longitude = 111d 01.353' = -111.05588
Then
At NEAR, select data with sun elevation greater than 15 degrees (this limit is not critical). The median ratio of Rsw.global/Rsw.in = 0.9938. I note, however that there is hysteresis in the plot of Rsw.in.global versus Rsw.in. This is consistent with the observation that the up-facing radiometers at NEAR were not perfectly leveled because of problems with the radiometer mounting device.
 :
:


As we took instruments down, we (mostly) compared to the printed list from set-up. Here, I'll copy down what we saw and indicate in red those sensors that changed.
We did not record TRH serial numbers, since those generally were not marked from the outside (and are recorded in the data stream anyway). One exception is TRH.30m.near, for which #030 was replaced by #032 (number confirmed during tear-down).
None of the pressure array sensors or SSW sonics in the crater were logged at tear-down.
|
Near |
Rim |
Far |
Flr |
Base |
|---|---|---|---|---|---|
lowest CSAT |
0537 (3m) |
0739 (5m) |
0539 (3m) |
0536 (3m) |
|
krypton |
1392 |
|
1525 |
1394 |
|
10m sonic |
0538 |
1124 |
1133007 |
not noted |
not (yet) noted |
15m CSAT |
1122 |
0540 |
|
|
|
20m CSAT |
0856 |
1120 |
|
|
|
25m CSAT |
1117 |
0671 |
|
|
|
30m CSAT |
0672 |
1123 |
|
|
|
40m CSAT |
0674 |
0800 |
|
|
|
45m CSAT |
0720 |
|
|
|
|
50m CSAT |
0740 |
|
|
|
|
Barometer |
B10 (3m) |
122850 (5m) |
B4 (2m) |
not noted |
not noted |
Gsoil |
H983211 (005) |
|
H943149 (001) |
H993561 (003) |
|
Qsoil |
ECHO 012 (013) |
|
ECHO 001 (011) |
ECHO 006 (016) |
ECHO 005 |
1xTsoil |
025 |
|
017 |
020 |
|
4xTsoil |
TS018 |
|
TS012 |
TS011 |
|
TP01 |
200239 (TP005) |
|
200589 (TP001) |
200591 (TP004) |
|
Rsw.in |
970378 |
|
940181 |
050824 |
|
Rsw.out |
970377 |
|
940186 |
040740 |
|
Rlw.in |
100225 |
|
030675 |
940185 |
|
Rlw.out |
100226 |
|
030676 |
940187 |
|
SPN1 |
A465 |
|
|
A837 |
|
Wetness |
not noted |
|
R1-12 (035) |
not noted |
|
Yesterday, Tim, Kurt, John, Chris finished stripping rim and removed the top 40'. I was given the day off to explore a larger hole in the ground.
Today plan to split into 2 groups: 1 to finish dismantling rim and the other to strip near.
Sat. Evening update:
- 449 tower totally stripped
- Rim dismantled/pieces retrieved/ready for helo. This makes us completely ready for helo ops (3 days before helo arrives)
- Near totally stripped, ready to be dismantled (also need to retrieve solar panels and rad stand). Data taking stopped about 10:00AM.
- Base still has a wind sonic mounted (but not taking data since Thursday).
Sun. Afternoon update:
- Removed top guys/beacon/first tower section from near, before winds became intolerable
Mon. Afternoon update:
- Removed the rest (160') of near (despite "breezy" winds) with a 5-person crew. Site now totally clear.
- (Towers still up at 449 and base. Base still has its (disconnected) 2D sonic on the top.)
Tues. Afternoon update:
- Helo ops complete. Everything out of crater; fencing panels taken into crater; concrete block anchors and frames removed from rim (just using the rebar).
- ISS rental lidar loaded into NCAR (Tim's) trailer
- Utah lidar loaded into Utah trailer. Utah/KIT equipment now packed and ready for their drive home tomorrow.
- Removed tower at base.
- Just have one tower section (deliberately) left at rim and the ISS 40' tower left to take down.
Today was a crater day with all ISF and most Utah staff. ISF equipment is now completely packed and (nearly) ready for helo operations. Base tower is now shut down as well.
Floor GPS positions:
Location |
Latitude |
Longitude |
DOP |
|---|---|---|---|
FLR Tower |
35d 01.686' |
111d 01.342' |
5 |
Radiometer stand |
35d 01.680' |
111d 01.353' |
5 |
Soil plot |
35d 01.680' |
111d 01.341' |
5 |
Soils depths (approx):
Single Tsoil: 1cm
Quad Tsoil: Nub just below surface
Gsoil: 1cm
Qsoil: 2cm
TP01: 2.5cm
Some of the cables were slightly exposed. Chris and I wondered if rain/wind removed some of the soil layer. I took a few photos.
flr boom angles (calibrated DataScope at this location just before making reading):
3m CSAT: 39.8d looking into array
10m RMYoung: 346.8d looking along boom, aligning two transducers, junction box on back side (to the north).
Noon today was the (new) official end of operations. This morning, Tim, Kurt, John, and I completed tear-down of far.
Since people had asked, these are my GPS locations at far (Sebastian said he took his own readings yesterday).
Postion |
Latitude (N) |
Longitude (W) |
DOP |
|---|---|---|---|
far tower |
34d 58.007' |
111d 03.182' |
5m |
rad stand |
34d 58.002' |
111d 03.174' |
5m |
soil plot |
34d 57.997' |
111d 03.172' |
5m |
In the afternoon, Tim again climbed with the other 3 of us on the ground to strip 6 of 8 levels from Rim.
End-of-day status (not <too> bad for a project that ended at noon!):
- Trailer: All computers packed; networking down (but not yet packed). (Had to disconnect AP24, Hughes, and base DSM since cables ran through space needed for packing.)
- Far: Totally removed (except Utah SODAR)
- Rim: 6/8 levels & 2/2 DSMS removed
- Base: Windsonic & DSM still running (just on battery), data only saved locally
- Flr: Should be completely running, data only saved locally
- Near: Tower should be running, data only saved locally. (No radiation or soil.)
- 449 site: Tower is up.
- Chris just arrived; Clayton leaves tomorrow.
This morning, John and I removed rads and soils from far, then near.
After lunch, stripped lower sensors from base tower, started packing base trailer.
10/29/13
Summary:
- Partial tear-down starting today
- Still breezy -- 15m/s winds
Actions past 24 hours:
- Continued Qsoil.base plot testing
To dos:
- Tear-down of near/far rad/soil
Sensor status (abbreviated):
QCtables/cockpit show all signals coming in.
P: noticed that NNE deviates from others in the crater -- presumably due to the strong winds
SPN1: Delta-T has suggested some tests, but won't have time to pursue.
Rlw.in: warm event last night at all sites -- must have been a low cloud
kh2o.flr: sharp lower kh2oV event happening right now <possibly a bit of rain, but hard to believe as I overlook the crater>
Labels:
10/28/13
Summary:
- This was supposed to be our down day, so John and I visited Walnut Canyon on our way in
- Preparing for tear-down
- The forecast winds came -- average >20m/s at rim.40m all day; gusts 10m.base also 20m/s
- Open house tonight (despite the blowing)
Actions past 24 hours:
- Continued Qsoil.base plot testing
- flr died just as we came in. We hesistated due to wind, but went into the crater anyway. DSM power cycle fixed. Lost data for ~4 hours.
To dos:
- Start packing up
Sensor status:
T/RH: ok.
P: ok. NNE clearly higher during these winds
csat u,v: sustained winds over 20m/s at near; 25m/s at rim; 15m/s at base
csat ldiag: ldiag firing at a low level on many of the sonics
csat w, tc: ok
kh2o: typical
motes: ok
Wetness: ok
radiation: typical
Tsoil: ok
Gsoil: ok
Qsoil: ok
Cvsoil: ok.
2D sonic: ok
John & Steve: 1:30-3:30. (Wind was wicked on the rim trail, but not bad on the way down. A fair amount of dust in the crater.)
flr wasn't pinging (and neither was flr lldar) as of 11AM today.
flr DSM wouldn't respond to console -- cycled power. Pocketec took a while to fsck, but then booted okay.
lidar generator had stopped (even though the gas tank was only at half). Sebastian and Eric came into the crater as well to diagnose/fix it.
Over the past 2 hours, starting 20:45, w.3m.near has gone down and up. Other w's don't show this behavior. ldiag is okay, spd and tc seem reasonable to me at first glance. The w time series looks okay, just with shifts. We'll need to see if this behavior persists.