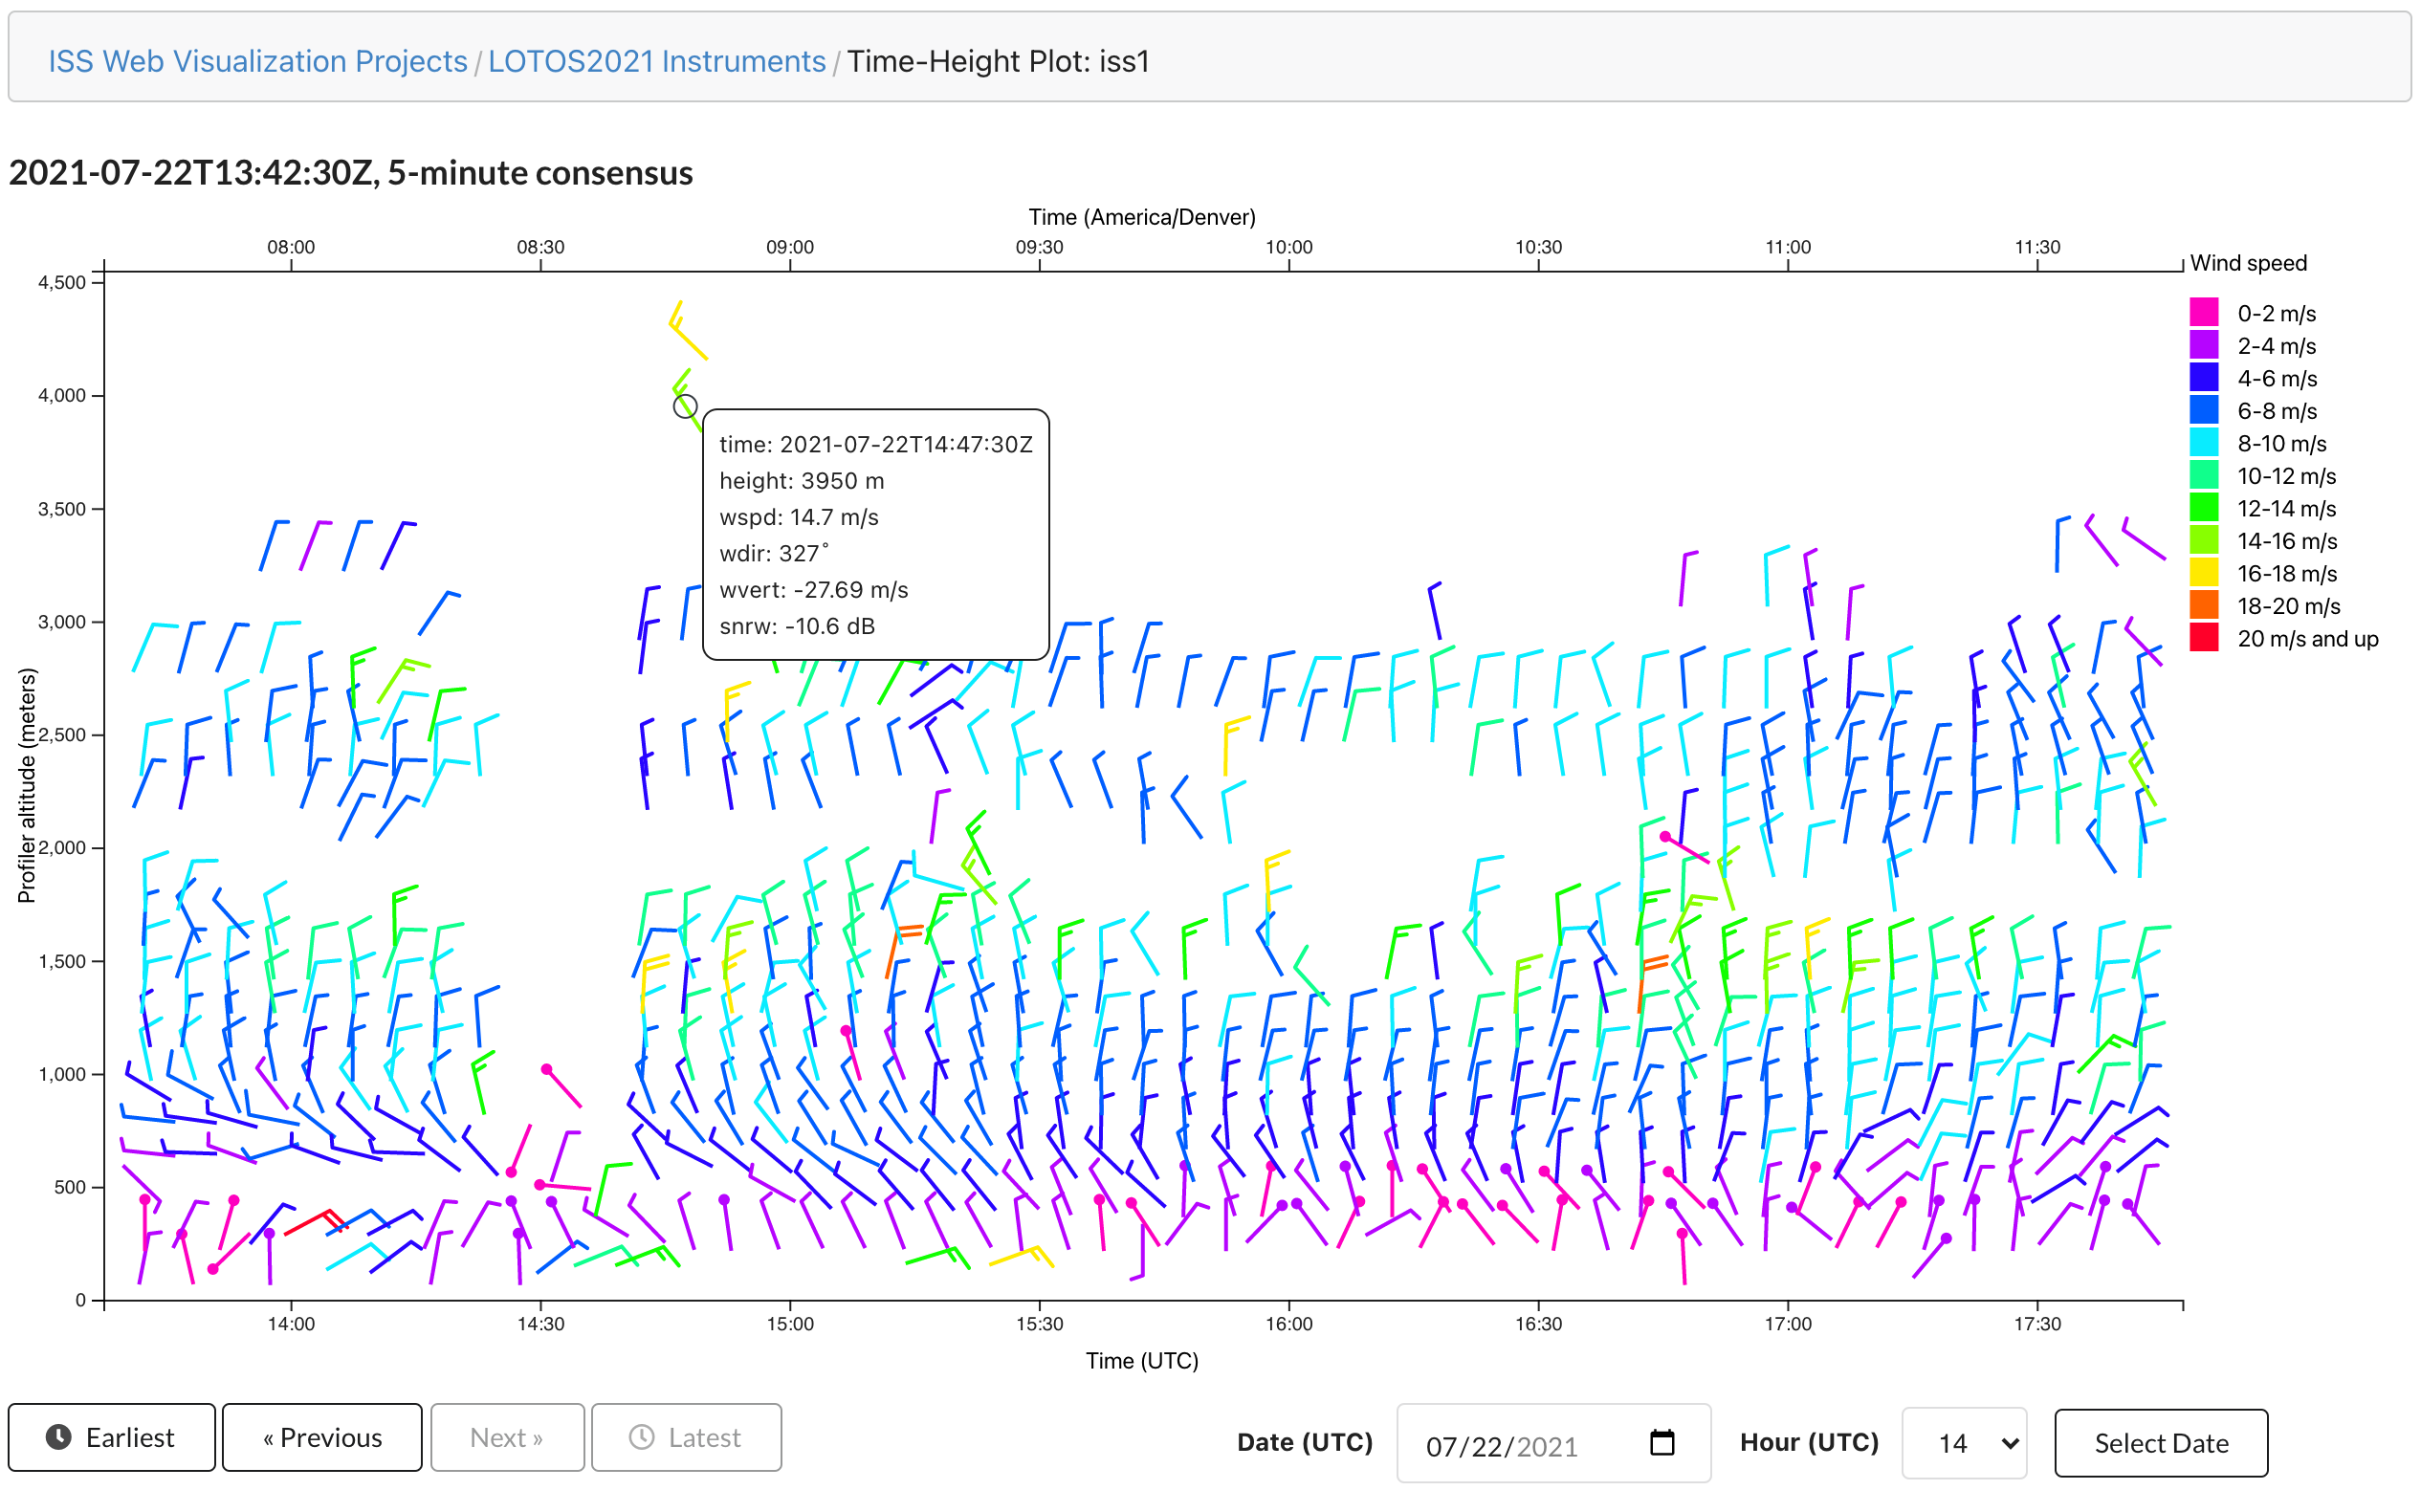
5-minute-consensus wind data from the ISS1 profiler (449MHz) at Marshall is available in the time-height-plot web-visualization tool that I have been working on:
Data for the extent of the project / all that is available in NetCDF files for 5-minute ISS1 is available in the time-height-plot.
New data for the current day is loaded at 10 minutes after the top of every hour (following generation of winds data at the top of every hour).
Color-coded windbarbs are displayed for profiles and temporal navigation is available via the buttons under the plot. Hovering over the spine of a windbarb reveals a popup with data for the profile.
I am currently working on supporting 30-minute-consensus ISS1 data and NIMA ISS4 (915MHz) data, hoping that will be available in the near future.
Thanks to everyone who has worked on generating the profiler data and NetCDF files!
Mobile-device caveat
The application uses responsive sizing to adapt to different display widths, but display on mobile devices, especially phones, has not received attention yet, so may not be all that great.
Also, Foothills
I have been working with Bill on displaying data from the profiler running at Foothills and things seem to be working well. Data for duration of project available here, updating with new data hourly:
Checked time series on NCharts & Dashboard since 7 July.
DSM Dashboard is offline as of this morning at least.
- TRH - ok
- P - ok
- Pirga
- Pirga.7m is offset from P.7m by +6mb (Pirga higher).
- Pirga.27m measures too high. Pirga.27m > Pirga.17m.
- Tirga
- Tmote showing wildly divergent values compared to all T measurements
- Radiometer - ok
- Rpile.in [-140, 0], Rpile.out [-25, 80] W/m2
- Rsw.in [-7, 1200], Rsw.out [-1, 200] W/m2
- Tcase - ok
- Wetness - ok
- Soils
- Gsoil - ok [-30, 65]W/m2
- Lamdasoil - ok overall
- Data gap between 4 July ~11:30 - 13 July ~12:00
- QC Note - anomalously large dip from 14 July 01:02:30 to 09:57:30.
- Qsoil - units changed from vol% to m^3/m^3 fraction. Ok [0, 14]%
- Tau63 - ok overall
- Data gap between 4 July 11:27:30 - 13 July 12:52:30
- QC Note - A few spikes to filter
- Tsoil - ok
- 0.6 cm [13, 55] degC
- 1.9 cm [16, 44]
- 3.1cm [17, 39]
- 4.4 cm [18, 35]
- Sonic - ok
- co2/h2o
- co2 - ok-ish? co2.7m > co2.27m > co2.17m
- Spikes on 13 July, 14 July (lightning?) rearrange the co2 time series - don’t know if that’s to be expected.
- h2o/co2 at 27m not reporting since 19 July 14:22:30. With the Dashboard offline I'm unsure if this is NCharts or instrument related.
- QC Note: h2o spikes on 18 July.
- Tcase - ok
- Batteries
- Vheat - ok overall
- Data gap between 4 July 11:27:30 - 13 July 12:52:30
- QC Note - A few spikes to filter
- iload - ok. Units changed on NCharts from mA to A. [1.85 - 2] A
- icharge - ok. Units changed on NCharts from mA to A. [-.175 to 0.025] A
- Vbatt - ok
- l3mote - elevated between 8-14 July. Hovering around 50 mA since 15 July.
- lmote - same as l3mote. Hovering around 15 mA since 15 July.
- Vcharge - ~27.9 V
- Rfan - range 5400 - 5600 rpm

Josh and I brought CLAMPS from Norman and, with BIll and I helping Josh, got it set-up, plugged in, and running (though Josh is tweaking several things). A good day!
About 3:30, a close (3s = 1000m) lightning strike caused a power glitch that stopped several of the profiling instruments. During the next hour, Bill and Josh recovered the systems that were affected.
I checked on the TP01, which has been giving quite erratic values. It seems to be wired okay, but now, even with pio power cycling, is giving bad or missing data. I guess replacement is the next step?
I also checked on the EC150s. During the rain, I chased some missing/erratic data that all became okay after the rain dried. That felt kind of foolish... Nevertheless, there are large calibration offsets that appear to change in amount, with these shifts primarily associated with rain events. This is not promising towards getting stable calibrations and gradients from these sensors,
Prompted by Jacquie noticing an outage in TP01 data, I used rserial to send an "si" command to force the mote to rescan its I2C buss. This immediately reconnected to the TP01 data stream. I don't know why/how the mote stopped collecting data from it (on 4 July).
Reviewed the measurements on NCharts since 1 July.
- TRH - ok
- P - ok
- Radiometer - ok
- Rpile.in [-125, 0], Rpile.out [-25, 60] W/m2
- Rsw.in [-7, 1200], Rsw.out [-1, 200] W/m2
- Tcase - ok - generally measures higher than T [10, 35] degC
- Wetness - ok
- Soils
- Gsoil - ok range [-20, 65]W/m2
- Lamdasoil - ok overall
- QC Note - anomalously large dip from 2 July 19:00 to 3 Jul 10:45.
- Qsoil - values remain low (< 1% vol)
- Tau63
- QC Note - Spikes from 2 July ~18:42 that are now flatlined at 0.02 s
- Tsoil - Tsoil.0.6cm seems too high or too low compared to the others. Maybe this is real, but can someone double check on their visit out there?
- Vheat - ok overall
- QC Note - Same as Landasoil - anomalously large dip from 2 July 19:00 to 3 Jul 10:45.
- Sonic - ok
- co2/h2o
- co2 - ok [550,650]
- h2o - I just noticed that around 25 June ~ 14:12, h2o.27m values jumped and are now much higher than h2o.17m and h2o.7m. Steve did a power cycle sometime on 26 June but that didn’t seem to do much. H2o.27m remains higher than expected.
- Tcase - ok
- iload - ok range - 1800 - 2000 mA
- icharge - ok range -175 to -25 mA
- Vbatt - ok
- l3mote - elevated during the 4th July weekend at ~ 100 and 125 mA. Hovering around 65 mA
- lmote - elevated during the 4th July weekend at 25-35 mA. Hovering around 18 mA
- Lamda - no values on Ncharts. Data stopped at 15 June.
- Pirga -
- Pirga.7m is offset from P.7m by +6mb (Pirga higher).
- Pirga.27m measures too high - Pirga.27m > Pirga.17m.
- Tirga
- Tmote is showing wildly varying numbers compared to Tirga
- Rfan - range 5400 - 5600 rpm
- Vcharge - ~27.9 V
Check time period since 30 June via NCharts
- TRH - ok
- P - ok
- Radiometer - ok
- Rpile.in [0, -150], Rpile.out [-10, 80] W/m2
- Rsw.in [-7, 1200], Rsw.out [-1, 200] W/m2
- Wetness - ok
- Soils
- Gsoil - ok range [-30, 50]W/m2
- Lamdasoil - ok
- Qsoil - values remain low (< 1% vol)
- Tau63 - ok range 6-10 s
- Tsoil - Tsoil.0.6cm values swing too high and too low compared to the others. Can someone double check on their visit out there?
- Vheat - ok
- Sonic - ok, Big spike 1 july ~1600 likely related to the high winds and storm that passed through. Ldiag is elevated that day between 1600 & 1900
- co2/h2o
- Unrealistic co2.2.7m and co2.7m values 1 July ~ 1520 - 1952 (passage of a severe storm.
- H2o also doesn’t look right during that time, particularly at 7m.
- iload - ok range - 1820 - 1950 mA
- icharge - ok range -180 to -10 mA
- Vbatt - ok
- l3mote - without the spikes range is 45-60 mA
- lmote - with the spikes range is 13-17 mA
- Lamda - no values on Ncharts
- Pirga - ok
- Tirga
- Tmote is showing wildly varying numbers compared to Tirga
- Rfan - range 5400 - 5600 rpm
- Vcharge - ~27.9 V