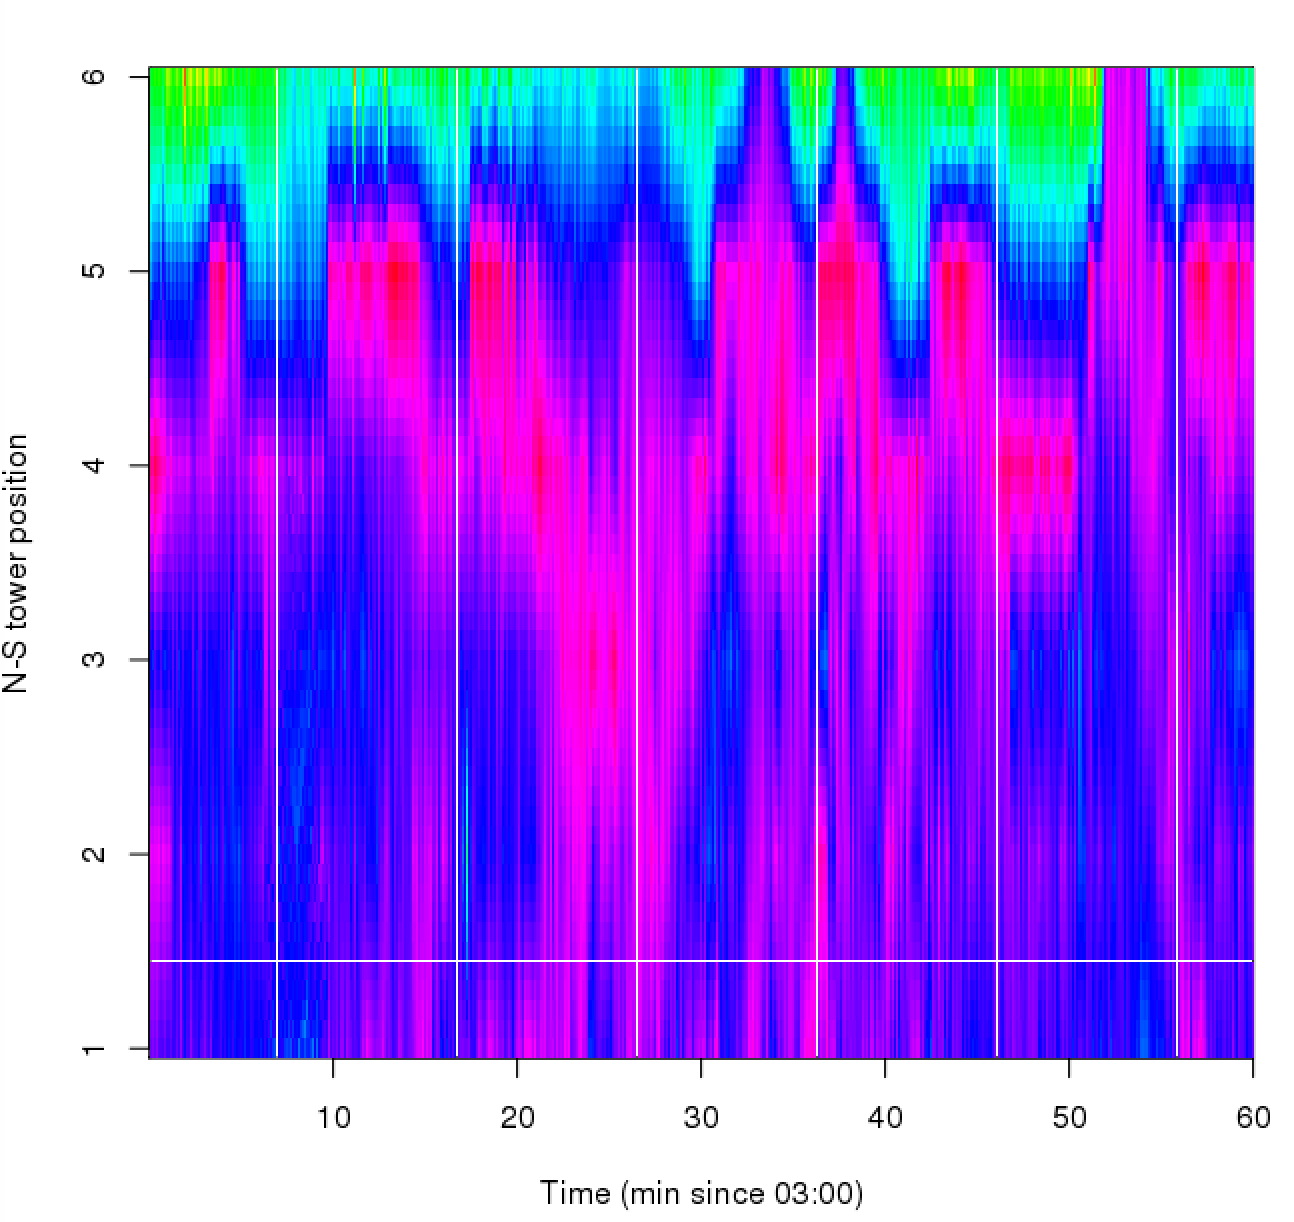
For my own records, 4 hours of data have been analyzed so far from Christoph's system: 11/20-21: 0300-0700Z. This shows a cold air microfront of several degrees with an axis most of the way up the north slope of the gully, in conditions with Northwest winds. Occasionally, the front makes it to the top of the North slope. Attached is a simulation for the first hour of what the fiber sees (albeit with much higher spatial resolution) using sonic tc data.
Screen Shot 2015-05-21 at 5.29.53 PM.png