...
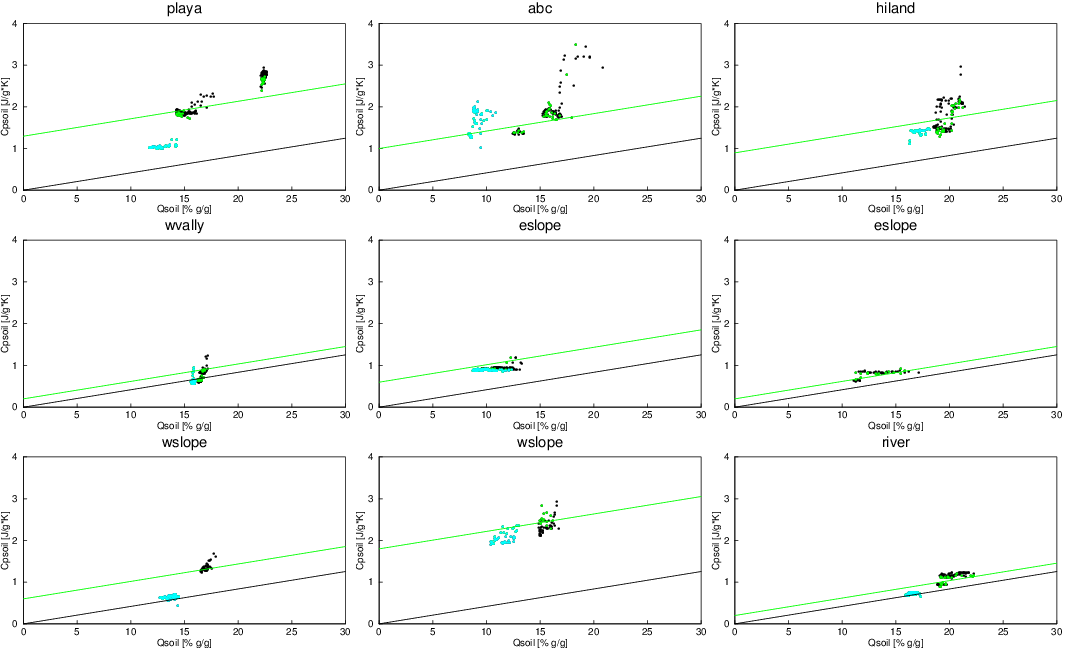
Points in blue are for the first month of the project, when probes may have been settling (actually, mostly not too bad). Arguably, these values may be ignored. Points in green are for tsoil>5C, when soil should not have ice. The black line is the expected variation of Cvsoil with Qsoil (4.184 J/kgK for 100% soil moisture by mass) with no dry soil heat capacity. Actual values should fall along a the green line, which is parallel to (and above) this linethe black line and has been fitted by assuming dry soil heat capacities of 1.3,1.0,0.9,0.2,0.6,0.2,0.6,1.8,0.2 J/kg K, respectively, for each of the sites.