Two merged archive files have been found with fairly big blocks of backwards samples.
The statsproc process logs the following after every 100 backwards samples, and many were seen in the logs of processing the PCAPS data.
2013-01-01,22:45:17|WARNING|NearestResampler: sample id 2,102 backwards by 2325.2 sec at 2011 01 26 22:21:05.469201
I re-sorted the data with a 1 hour sorter in nidsmerge:
nidsmerge -s "2011 01 29 16:00" -e "2011 01 30 00:00" -i isfs_20110129_160000.dat.bz2 -r 3600 -o $s/isfs_%Y%m%d_%H%M%S.dat.bz2 -l $((8*3600))
The files have been replaced on /scr/isfs and on the HPSS.
Here are data_stats listing of the old and new files.
We did not have the opportunity to calibrate the pyrgeometers prior to the start of PCAPS, and therefore used old thermopile calibration factors for the Kipp & Zonen CG4 and Eppley PIR pyrgeometers. These were subsequently recalibrated in the NOAA black body on March 8 & 10, 2011. The following table lists multiplicative correction factors for Rpile outputs during the PCAPS field program.
Sensor |
Location |
Position |
Pre-ops |
Post-ops |
Correction |
k* |
|---|---|---|---|---|---|---|
|
|
|
uV-m^2/W |
uV-m^2/W |
pre/post |
|
PIR 031980 |
Playa (1) |
in |
3.58 |
3.58 |
1.000 |
4.0 |
PIR 031976 |
Playa |
out |
3.93 |
3.74 |
1.051 |
3.5 |
PIR 031975 |
ABC (2) |
in |
3.97 |
3.98 |
0.997 |
3.5 |
PIR 031978 |
ABC |
out |
3.50 |
3.53 |
0.992 |
4.0 |
CG4 050824 |
Highland (3) |
in |
14.09 |
13.81 |
1.020 |
NA |
CG4 040740 |
Highland |
out |
7.85 |
7.76 |
1.012 |
NA |
CG4 030675 |
West Valley (4) |
in |
9.97 |
9.93 |
1.004 |
NA |
CG4 040741 |
West Valley |
out |
8.82 |
8.76 |
1.007 |
NA |
PIR 031979 |
East Slope (5) |
in |
3.99 |
3.81 |
1.047 |
4.5 |
PIR 031981 |
East Slope |
out |
3.69 |
3.66 |
1.008 |
3.5 |
CG4 100225 |
West Slope (6) |
in |
11.93 |
11.28 |
1.058 |
NA |
CG4 100226 |
West Slope |
out |
11.51 |
10.81 |
1.065 |
NA |
CG4 050823 |
Riverton (7) |
in |
9.32 |
9.21 |
1.012 |
NA |
CG4 030676 |
Riverton |
out |
11.27 |
11.21 |
1.005 |
NA |
*per Ellsworth Dutton, blackbody values for k have been increased by 0.3 and then rounded up to nearest 0.5

When the TP01 is power cycled, the values for the first 300? seconds (while it is taking its first reading) are not valid. In the present raw_data, Vheat and Tau63 are set to missing values during this period, but not Lambdasoil (which reads as 0). These spikes to zero are averaged into the 5min means of Lambdasoil, which introduce spikes into our Cvsoil values and eventually Gsfc. Ordinarily, this <shouldn't> be much of a problem, but it appears that there were periods during PCAPS when these systems were power cycled quite often (e.g. every 5 hours on 21 Jan). Presumably these were mote or power issues -- I haven't yet checked.
Regardless, it would be best to set all TP01 values to NA during these start-up periods.
UPDATE to the below discussion:
After discussions with Tom, I've realized that my entire philosophy of deriving soil moisture in frozen conditions from Cv is flawed. In mixed conditions, Cv = Cv_liq * Qsoil_liq + Cv_ice * Qsoil_ice + Cv_dry, where Cv_liq = 4.81 and Cv_ice = 2.11. Supposedly, from the plots below, I can compute Cv_dry by looking at the relation between Cv and Qsoil_liq when Qsoil_ice is zero (Tsoil well above freezing). IF it was known that Qsoil_liq was zero (Tsoil well below freezing), this Cv relation could be used. However, in mixed conditions, I don't know how much moisture is liquid or ice, so I can't independently compute soil water content (in any phase or combined). Thus, I have 3 situations:
1. Soil not frozen: TP01 gives redundant Qsoil_liq to EC-5, once calibrated (using the EC-5). Thus, not really independent.
2. Soil totally frozen: TP01 gives Qsoil_ice, once calibrated in totally warm conditions using the EC-5. This is a unique measurement, but requires a long-term project.
3. Mixed soil conditions: TP01, combined with EC-5, gives Qsoil_ice, once calibrated in totally warm conditions using the EC-5. As this procedure has several steps, there would be a large uncertainty in the result!
-------------------------------------
I've been trying to figure out why the Qsoil/Csoil comparison has looked lousy at most sites. What I've found:
1. I now have better values for the soil densities than my first cut at looking at the data (which only used the first set of gravimetric measurements). I'm now using the mean of all measured values at 3-6cm. (There sometimes is a lot of variation between these measurements.)
2. The soil motes apparently had a "watchdog timeout" that reset power on the soil sensors rather frequently. I believe that this occurred at all sites sometime, and, when bad, happens every ~4hours:50minutes. Each time, the TP01 reported values of 0 until it was able to take another reading. These 0 values were averaged in to each TP01 variable, generating lots of spikes. A range check on the TP01 Vheat and Tau63 values has now been added to eliminate these zeros. The covars are being rerun now.
(Note that gaps of one sample (5 s) every 5-minutes are normal, as John's code uses this time to sample the mote's power voltage.)
3. Even with all this, the comparison is good at only about 1/2 of the sites. ("Good" means that the change of Cvsoil with Qsoil follows what I would expect. "Bad" means that Cvsoil changes more than I would expect.) I can trace the bad values to Vpile.on being too low at many of the sites. (asoil values seem reasonable at all sites and Vpile.off and Vheat -- the only other variables in the Lambdasoil calculation -- are okay.) This is true at most of these sites even during the last half of January, when there was a warm period that might have thawed the soil. Possible reasons for Vpile.on being low are:
a. Inadequate contact between the probe and soil (the most likely culprite, despite my best efforts)
b. Voltage drop on Vheat (unlikely, since the 4-wire probe should measure this)
c. Electrical contact problem on Vpile (unlikely, but should be checked)
d. Heat going into latent heat of fusion (melting mixed-phase moisture), rather than sensible heat (can partly check by looking at warm periods -- a new idea for me). [The results of this check are not very convincing -- see below plot.]
4. Horizontal lines on the plot below are caused by rapid changes of measured qsoil (which is really liquid qsoil) that, in the one case I examined in detail, was caused by rapid warming (and thus melting) of the soil. The portion of this change that occurs in the 3 hours that the TP01 is reporting replicate values appears as a horizontal line. I'll update this plot with data values averaged to 3hours to eliminate this artifact, but there still will be the question of whether the qsoil value is valid.
By the way, the warming case I found is 23 Jan, near noon, at ABC.
This is closer than I've been before with this comparison, but I still have a long way to go.
Attached is my current comparison plot for each of the 9 soil sites after filtering the statistics for:
- good Tau63 and Vheat values
- rerun of covars over first half of the data
- removing qsoil values when tsoil<0C
Points in blue are for the first month of the project, when probes may have been settling (actually, mostly not too bad). Arguably, these values may be ignored. Points in green are for tsoil>5C, when soil should not have ice. The black line is the expected variation of Cvsoil with Qsoil (4.184 J/kgK for 100% soil moisture by mass) with no dry soil heat capacity. Actual values should fall along the green line, which is parallel to the black line and has been fitted by assuming dry soil heat capacities of 1.3,1.0,0.9,0.2,0.6,0.2,0.6,1.8,0.2 J/kg K, respectively, for each of the sites.
In the "even newer" version, I've manually eliminated periods where I think there might be a chance of frozen soil moisture (that would give me a false qsoil measurement). This eliminates about 3/4 of the data, but greatly reduces the scatter.
Even newer plot:
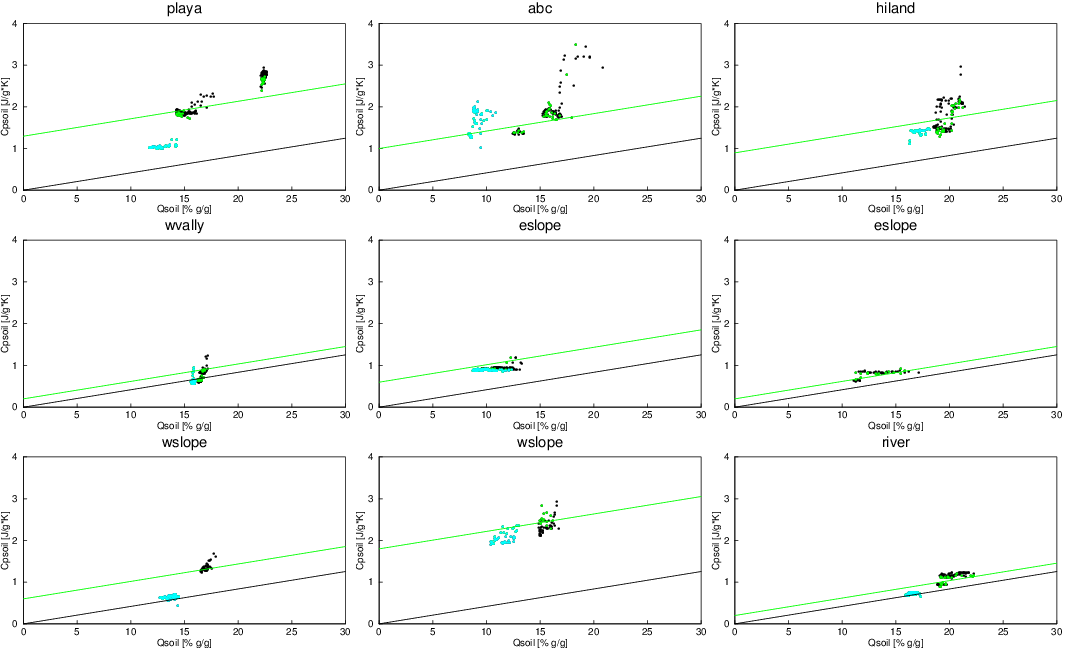
Updated plot:
Old plot:
Here are the site coordinates as recorded by Gordon in the netcdf files:
"We looked at the GPS output from each station, when there was satellite lock
and the lat and long were constant, and put them as non-time series variables
in the netcdf."
Site |
Latitude |
Longitude |
|---|---|---|
Playa(1) |
40.7786 |
-112.1031 |
ABC(2) |
40.7377 |
-111.9132 |
Highland(3) |
40.6969 |
-111.839 |
W Valley(4) |
40.681 |
-111.9949 |
E Slope(5) |
40.6135 |
-111.8039 |
W Slope(6) |
40.5938 |
-112.0621 |
Riverton(7) |
40.5136 |
-111.9737 |
From the Sept/Oct 2010 tests, I found that new, sensor-specific, calibrations of E.lambda and Tau63_ref from the agar test produced results with less scatter. Thus, the plan is to use these for data processing. Since I will need to rely on these values, it seems like a good idea to do agar post-cals on these probes. In addition, I might as well double-check the probe resistances, so Chris is now making a test cable that I'll use with the HP5006 plug-in 4-wire meter. With these revised calibrations, I'll go back and look at the PCAPS data when the soil wasn't frozen. Finally, we'll rerun some tests in the FLAB yard. I'm not planning a new set of keg tests.
Resistance values measured 15 Apr 2011 using 4-wire meter:
ID |
Sensor S/N |
R_measured (Ohms) |
R_manufacturer (Ohms) |
Difference (Ohms) |
|---|---|---|---|---|
1 |
200589 |
16.14 |
16.1 |
0.04 |
2 |
200590 |
15.40 |
15.4 |
0.00 |
3 |
200236 |
14.79 |
14.8 |
-0.01 |
4 |
200591 |
16.70 |
16.7 |
0.00 |
5 |
200239 |
16.37 |
16.2 |
0.17 |
6 |
200592 |
15.53 |
15.5 |
0.03 |
7 |
200241 |
16.27 |
16.2 |
0.07 |
8 |
200242 |
16.10 |
15.9 |
0.20 |
9 |
200243 |
15.76 |
15.6 |
0.16 |
10 |
200234 |
14.72 |
14.7 |
0.02 |
11 |
200238 |
15.50 |
15.4 |
0.10 |
|
200235 |
sliced |
14.8 |
|
|
200240 |
lightning fried |
15.0 |
|
All are within 0.2 ohms of manufacturer values. Except for one at 0.01 ohms, our values are higher. <Might> be connectors, but 4-wire measurement should compensate.
Agar results (first row Sep 2010, second row Apr 2011). Lambda values use original Hukseflux coefficients in this table:
ID |
Sensor |
Vheat (uV) |
Vpile.on (uV) |
Vpile.off (uV) |
V63 (uV) |
Tau63 (0.01s) |
Lambda (mW/m K) |
|---|---|---|---|---|---|---|---|
|
Expected |
1200000 |
|
0 |
|
1900 |
600 |
1 |
200589 |
1236927 |
375 |
0 |
139 |
1943 |
666 |
|
|
1236416 |
375 |
0 |
139 |
1921 |
665 |
2 |
200590 |
1194264 |
314 |
0 |
116 |
1940 |
668 |
|
|
1194652 |
314 |
0 |
116 |
1985 |
669 |
3 |
200236 |
1238958 |
313 |
0 |
116 |
1877 |
578 |
|
|
1237230 |
313 |
0 |
116 |
1892 |
576 |
4 |
200391 |
1240328 |
313 |
0 |
116 |
2073 |
686 |
|
|
1239126 |
313 |
0 |
115 |
2042 |
684 |
5 |
200239 |
1239719 |
470 |
0 |
174 |
1965 |
591 |
|
|
1238975 |
470 |
0 |
173 |
1972 |
590 |
6 |
200592 |
1237441 |
407 |
0 |
150 |
2125 |
655 |
|
|
1237288 |
407 |
0 |
150 |
2170 |
655 |
7 |
200241 |
1241515 |
376 |
0 |
139 |
1892 |
596 |
|
|
1239874 |
376 |
0 |
139 |
1867 |
595 |
8 |
200242 |
1236806 |
407 |
0 |
150 |
2089 |
600 |
|
|
1236332 |
407 |
0 |
150 |
2105 |
600 |
9 |
200243 |
1236372 |
438 |
0 |
162 |
1746 |
598 |
|
|
1236324 |
438 |
0 |
162 |
1755 |
598 |
10 |
200234 |
1237511 |
281 |
0 |
104 |
1679 |
603 |
|
|
1237304 |
281 |
0 |
104 |
1673 |
603 |
11 |
200238 |
1238329 |
439 |
0 |
162 |
1773 |
586 |
|
|
1236740 |
439 |
0 |
162 |
1792 |
584 |
All of these have very close agreement between the Sept 2010 and Apr 2011 values. Tau63 differences are 0-0.5s, Lambda differences are 0-2. Thus, best approach is to take the average of these values to generate new Tau63_ref and E.lambda values.
Thought I'd start by scribbling down the Agar recipe:
Add 7g agar flakes to 1.75l water in 2l beaker.
Place on 1000W burner of 2-burner hotplate.
Rig up a shroud and lid around beaker to reduce heat loss. I borrowed a chunk of pipe and PVC from the shop this time (see photo). The spot I used in the cage had a draft, so I used the blue foam to block it.
It took about 20min on high to get to a boil. I stir every couple of minutes using a glass rod Chris found to the left of the cal lab sink.
Reduce heat to medium-high and simmer with lid off (packet instructions said for 5min, TP01 said 20min, I did 15min this time). I noted that the volume reduced to 1.6l after all this time, which is still fine.
Let cool until milky white (several hours). 

March 14, 2011
TESTED GOOD: TS016, TS017, TS015, TS013(cleaned connector), TS005, TS011.
BAD: TS002, TS004, TS003.
TS012 tested good but had #4 sensor out.
The kryptons were checked in the chamber at 10C. The density range went from 1 to 9 g/m^3.
sensor |
error range (g/m^3) |
|---|---|
1525 |
1.52 to 3.00 |
1389 |
1.01 to 1.56 |
1390 |
0.65 to 0.81 |
1393 |
-0.21 to 0.02 |
1394 |
2.49 to 3.43 |
1133 |
1.88 to 2.47 |
1258 |
1.95 to 2.32 |
At the start of the project we did not have the new calibration coefficients for the KZ CM21 and EPPLEY PSP shortwave radiation sensors.
Therefore a correction factor must be applied to the data.
sensor |
location |
pistion |
cal factor |
|---|---|---|---|
EPP 16945 |
Playa |
in |
1.040632 |
EPP 17877 |
Playa |
out |
1.033604 |
EPP 17414 |
ABC |
in |
1.009423 |
EPP 15108 |
ABC |
out |
1.024915 |
KZ 940185 |
Highland |
in |
0.993432 |
KZ 970378 |
Highland |
out |
0.987761 |
KZ 970380 |
West Valley |
in |
1.002629 |
KZ 940181 |
West Valley |
out |
0.993238 |
EPP 16107 |
East Slope |
in |
1.023545 |
EPP 16714 |
East Slope |
out |
1.033453 |
EPP 26224* |
East Slope |
out |
1.013483 |
KZ 970379 |
West Slope |
in |
0.988474 |
KZ 940187 |
West Slope |
out |
0.993795 |
KZ 970377 |
Riverton |
in |
0.992930 |
KZ 940186 |
Riverton |
out |
0.999155 |
* removed Rsw.out at East Slope ~18:30 Dec 4; replaced 14:20 Dec 6
Post cal results of temperature, temperature range 15C to -20C
Sensor |
mean (error) |
sd (error) |
min to max |
|---|---|---|---|
017 |
.019 |
.014 |
-.036 to .001 |
023 |
.017 |
.012 |
-.004 to .030 |
019 |
.016 |
.014 |
-.001 to .032 |
013 |
.000 |
.006 |
-.007 to .010 |
025 |
-.008 |
.011 |
-.034 to .002 |
024 |
.002 |
.008 |
-.011 to .013 |
009 |
-.035 |
.007 |
-.044 to -.022 |
028 |
-.018 |
.007 |
-.028 to -.004 |
027 |
-.011 |
.016 |
-.027 to .02 |
Post cal of RH, two runs from 10% to 90% at 10C and -4C, Gortex still on
Sensor |
mean (error) |
sd (Error) |
min to max |
|---|---|---|---|
017 |
-3.3 |
0.9 |
-4.8 to -1.4 |
023 |
-1.7 |
1.2 |
-3.8 to -0.4 |
019 |
-8.6 |
1.2 |
-11.1 to -6.3 |
013 |
0.1 |
0.5 |
-0.7 to 0.8 |
025 |
0.7 |
1.44 |
-2.2 to 2.2 |
024 |
1.1 |
1.7 |
-1.1 to 3.8 |
009 |
-0.6 |
0.6 |
-1.1 to 0.9 |
028 |
0.6 |
1.9 |
-3.6 to 2.6 |
027 |
1.2 |
1.6 |
-2.1 to 2.6 |
Location of SHT sensors through out the project. Some sensors replaced during the project were sent back to Boulder for repairs then the sensor was deployed again
DATE of CHANGE
STATION |
11/28 |
12/07 |
12/12 |
12/13 |
1/15 |
11/16 |
1/17 |
1/18 |
1/27 |
1/28 |
2/6 |
2/7 |
1 |
13 |
|
9 |
26 |
|
|
21 |
|
13 |
|
|
13 |
2 |
15 |
21 |
|
|
|
|
24 |
|
|
|
|
24 |
3 |
20 |
|
|
|
|
|
19 |
23 |
|
|
|
23 |
4 |
19 |
|
|
|
|
25 |
|
|
|
|
|
25 |
5 |
18 |
|
|
|
|
|
|
|
|
9 |
17 |
17 |
6 |
23 |
24 |
|
|
|
|
27 |
|
|
|
|
27 |
7 |
17 |
|
|
|
28 |
|
|
|
|
|
|
28 |
A post cal of the barometers was completed today. Each barometer was run over the range of 800 to 900 mb.
The average error was .16 mb, error span was -.21 to .26 mb, sd was .06
Sensor |
1 |
2 |
3 |
4 |
5 |
6 |
7 |
|---|---|---|---|---|---|---|---|
CSAT3 |
0537 |
0800 |
0855 |
853 |
0671 |
1119 |
0539 |
Krypton |
1395 / 1390 (1/2/11) |
1393 |
1525 |
1258 |
1133 |
1389 |
1394 |
Barometer |
B8 |
B7 |
B3 |
B10 |
B4 |
B5 |
B9 |
TRH |
|
|
|
|
|
|
|
Propvane |
00318 |
---------------- |
---------------- |
--------------------- |
-------------------- |
??? |
------------------- |
Rad. IN (pyn/pyg) |
16945 / |
17414 / |
940185 / |
970380 / |
16107 / |
970379 / |
970377 / |
Rad. OUT (pyn/pyg) |
17877 / |
15108 / |
970378 / |
940181 / |
26224 / |
940187 / |
940186 / |
LiCor |
PY7121(DIR) |
---------------- |
---------------- |
--------------------- |
------------------- |
--------------- |
PY10835(DIR) |
Tsoil |
TS017 |
TS016 |
SING(026) |
TS002/TS015 |
TS023 |
TS013 |
TS005 |
Qsoil |
ECHO007(017) |
ECHO010(020) |
ECHO005(015) |
ECHO009(019) |
ECHO004(014) |
MISSING |
ECHO002(012) |
Gsoil |
H993563(007) |
H013390(009) |
H983211(005) |
H023009(002) |
H013391(004) |
H993561(003) |
H983213(008) |
TPO1 |
TP025(200590) |
TP006(200592) |
TP005(200239) |
TP007(200241) |
TP009(200243) |
TP010(200234) |
TP001(200589) |
Rain Gauge |
--------------------- |
--------------------- |
??????????? |
???????????? |
------------------- |
???????????? |
-------------------- |
Motes |
B,7,19 |
F,4,5 |
D,22,6 |
15,15,8 |
13,12,11,20 |
11,10,9,21 |
17,16,18 |
Vbatt |
31 |
32 |
38 |
34 |
35 |
36 |
37 |
Viper |
16 |
1 |
14 |
12 |
|
6 |
3 |
I've just plotted Cvsoil from the entire project to see if I could determine a time when the TP01 (as a surrogate for all soil sensors) had "healed" into the soil. I see a definite step at about 7 Dec at 1, 5, 6, and to some extent 6.aux and 7. This was a few days into the first PCAPS warming period with temperatures above freezing. Given what comes later (other steps in Jan), it isn't obvious that the TP01 had completely settled in (perhaps ever). Thus, the most definite conclusion I can make is that at least half of the sensors took at least 5 weeks to settle in.
February 7
~13:30 removed rain gauge, W Valley
14:30 removed rain gauge, Hiland
Precip started 15:00