...
| Wiki Markup |
|---|
d. Heat going into latent heat of fusion (melting mixed-phase moisture), rather than sensible heat (can partly check by looking at warm periods \-\- a new idea for me). \[The results of this check are not very convincing \-\- see below plot.\] |
4. Horizontal lines on the plot below are caused by rapid changes of measured qsoil (which is really liquid qsoil) that, in the one case I examined in detail, was caused by rapid warming (and thus melting) of the soil. The portion of this change that occurs in the 3 hours that the TP01 is reporting replicate values appears as a horizontal line. I'll update this plot with data values averaged to 3hours to eliminate this artifact, but there still will be the question of whether the qsoil value is valid.
By the way, the warming case I found is 23 Jan, near noon, at ABC.
This is closer than I've been before with this comparison, but I still have a long way to go.
...
Points in blue are for the first month of the project, when probes may have been settling (actually, mostly not too bad). Arguably, these values may be ignored. Points in green are for tsoil>5C, when soil should not have ice. The black line is the expected variation of Cvsoil with Qsoil (4.184 J/kgK for 100% soil moisture by mass) with no dry soil heat capacity. Actual values should fall along the green line, which is parallel to the black line and has been fitted by assuming dry soil heat capacities of 1.3,1.0,0.9,0.2,0.6,0.2,0.6,1.8,0.2 J/kg K, respectively, for each of the sites.
Updated plot: 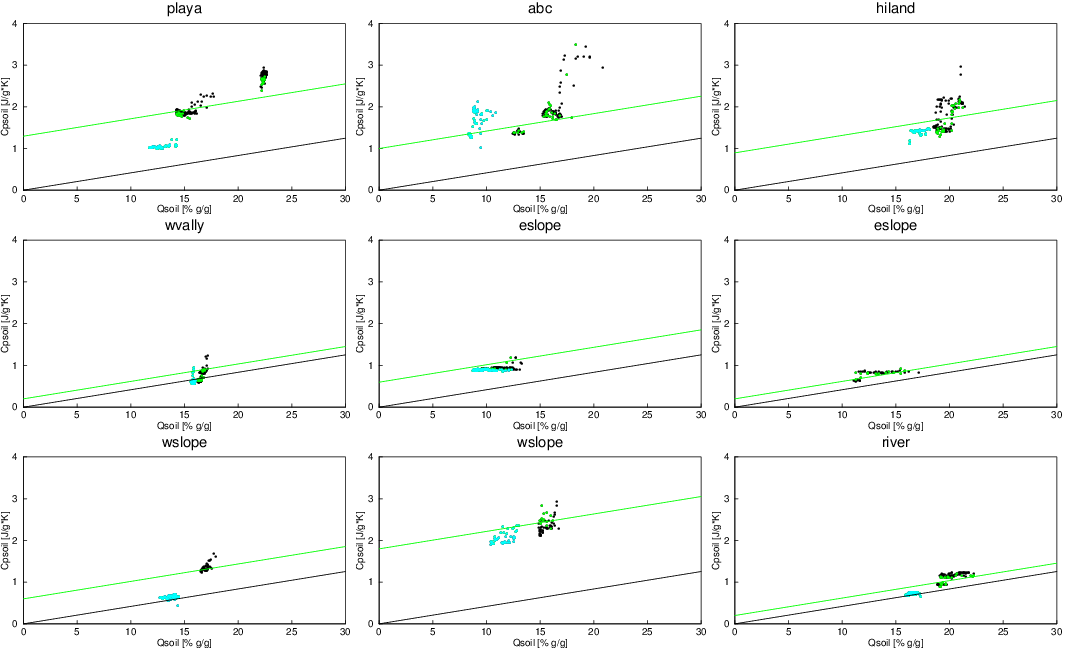
Old plot: