UPDATE to the below discussion:
After discussions with Tom, I've realized that my entire philosophy of deriving soil moisture in frozen conditions from Cv is flawed. In mixed conditions, Cv = Cv_liq * Qsoil_liq + Cv_ice * Qsoil_ice + Cv_dry, where Cv_liq = 4.81 and Cv_ice = 2.11. Supposedly, from the plots below, I can compute Cv_dry by looking at the relation between Cv and Qsoil_liq when Qsoil_ice is zero (Tsoil well above freezing). IF it was known that Qsoil_liq was zero (Tsoil well below freezing), this Cv relation could be used. However, in mixed conditions, I don't know how much moisture is liquid or ice, so I can't independently compute soil water content (in any phase or combined). Thus, I have 3 situations:
1. Soil not frozen: TP01 gives redundant Qsoil_liq to EC-5, once calibrated (using the EC-5). Thus, not really independent.
2. Soil totally frozen: TP01 gives Qsoil_ice, once calibrated in totally warm conditions using the EC-5. This is a unique measurement, but requires a long-term project.
3. Mixed soil conditions: TP01, combined with EC-5, gives Qsoil_ice, once calibrated in totally warm conditions using the EC-5. As this procedure has several steps, there would be a large uncertainty in the result!
-------------------------------------
I've been trying to figure out why the Qsoil/Csoil comparison has looked lousy at most sites. What I've found:
...
c. Electrical contact problem on Vpile (unlikely, but should be checked)unmigrated-wiki-markup
d. Heat going into latent heat of fusion (melting mixed-phase moisture), rather than sensible heat (can partly check by looking at warm periods \ -\- a new idea for me). \ [The results of this check are not very convincing \ -\- see below plot.\]
4. Horizontal lines on the plot below are caused by rapid changes of measured qsoil (which is really liquid qsoil) that, in the one case I examined in detail, was caused by rapid warming (and thus melting) of the soil. The portion of this change that occurs in the 3 hours that the TP01 is reporting replicate values appears as a horizontal line. I'll update this plot with data values averaged to 3hours to eliminate this artifact, but there still will be the question of whether the qsoil value is valid.
...
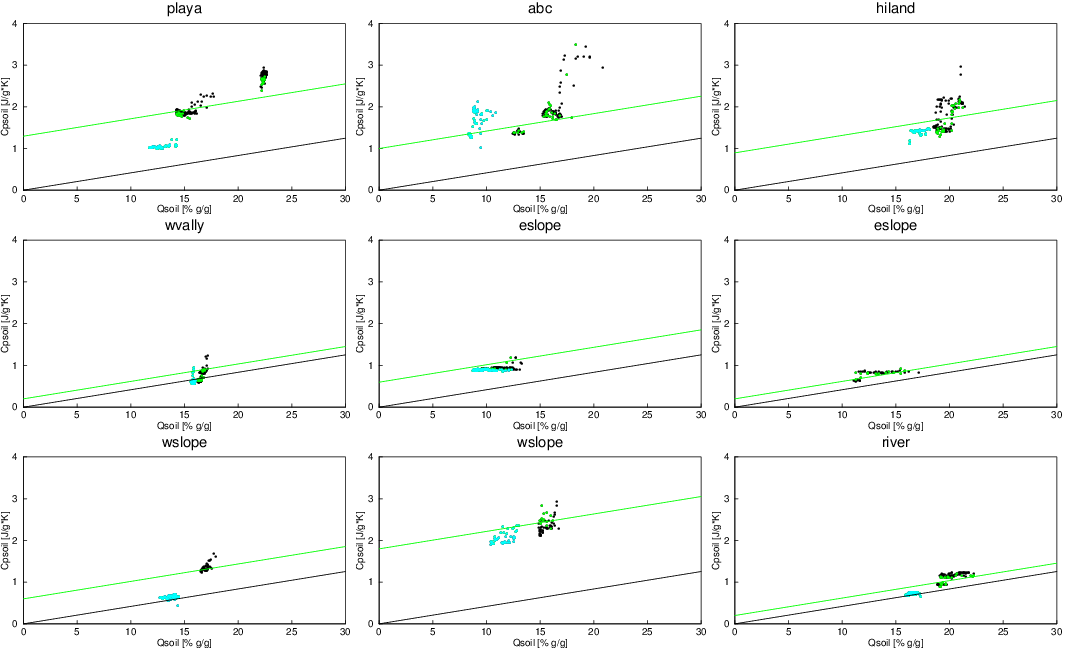
Points in blue are for the first month of the project, when probes may have been settling (actually, mostly not too bad). Arguably, these values may be ignored. Points in green are for tsoil>5C, when soil should not have ice. The black line is the expected variation of Cvsoil with Qsoil (4.184 J/kgK for 100% soil moisture by mass) with no dry soil heat capacity. Actual values should fall along the green line, which is parallel to the black line and has been fitted by assuming dry soil heat capacities of 1.3,1.0,0.9,0.2,0.6,0.2,0.6,1.8,0.2 J/kg K, respectively, for each of the sites.
In the "even newer" version, I've manually eliminated periods where I think there might be a chance of frozen soil moisture (that would give me a false qsoil measurement). This eliminates about 3/4 of the data, but greatly reduces the scatter.
Even newer plot:
Updated plot:
Old plot: