...
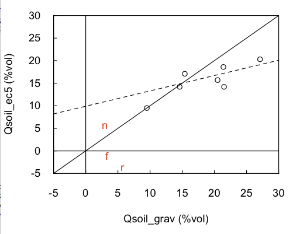
Here is a plot of these data, along with a 1:1 line and a linear regression to all but the first sample (when the EC-5 might not have been settled in). The regression line has an intercept of 9.9% and a slope of 0.34. Also shown are the 3 gravimetric samples at far (f), near ![]() , and flr (r). It was my intent that this slope would be applied to all of the METCRAXII Qsoil measurements, and to have the offset computed from the 1 gravimetric sample at each site.
, and flr (r). It was my intent that this slope would be applied to all of the METCRAXII Qsoil measurements, and to have the offset computed from the 1 gravimetric sample at each site.
With this philosophy, the adjustments are:
...
Subtracting only 7.6 (rather than 9.6) from flr makes the agreement quite good. Next, would be to check Cvsoil to see if sensor gains are consistent?
Using the in-field Qsoil adjustment (just a one-point bias correction), I see:
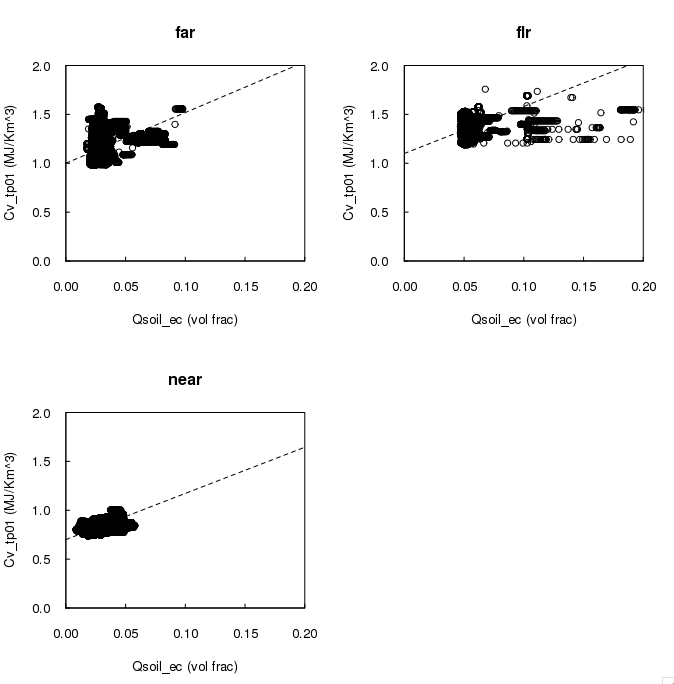
In this plot, I have placed an eyeball fit of a line with a slope equal to Cv_h2o through the data. Only at near is a systematic variation seen of Cv with Qsoil. If anything, the near plot has (slightly) too low a slope (Qsoil gain too high). I would say that this plot does not justify increasing the measured Qsoil values by a factor of 3.
To conclude:
- The test at base suggested increasing the Qsoil gain by a factor of 3. However, applying this correction to the site values makes negative values, too large flr values, and worse comparisons with Cvsoil from the TP01.
- The one-point in field adjustment of just the bias has none of these problems, though flr then is consistently larger by ~2%.