I just added a spare Qsoil to base in a plot that I will water. My goal is to characterize the behavior of an EC-5 probe in this soil with high iron content. Hopefully, it will still have a slope of 1, but just an offset. Although the soil structure changes a bit from site-to-site here, the iron content appears (based on my magnet test) to be about the same at base as at near, so I am optimistic that these test results will be relevant to the other sites.
Probe is ECHO005/PIC015.
The plan is simply to water this plot to field capacity and watch it dry out, while taking gravimetric samples regularly -- at least daily.
15:00 took the first sample (still before wetting; soil was a little bit moist). I'll just measure the 3-6cm ring, as being close to the location of the EC5 (volume = 3*pi*(5.31/2)^2 )
10/25: 09:35 First watering. Water ponded. I'll wait a bit and reapply.
09:45 Second watering. EC5 still hasn't seen it.
10:00 Water #3. EC5 still hasn't seen it.
10:15 Water #4. EC5 noticeably rising.
10:45 Water #5. EC5 up quite a bit.
11:05 Water #6.
11:15 Water #7. I'll stop here.
11:40 EC5 beginning to flatten out.
Date | Time | Tare | Wet | Dry | Rho | Grav% | Vol% | EC-5 |
|---|---|---|---|---|---|---|---|---|
10/24 | 15:00 | 2.4 | 84.3 | 77.8 | 1.14 | 8.3% | 9.5% | 9.5% (EXACT!) |
10/25 | 13:30 | 8.2 | 129.0 | 111.0 | 1.55 | 17.5% | 27.1% | 20.3% |
10/25 | 16:45 | 8.2 | 117.0 | 102.8 | 1.42 | 15.0% | 21.4% | 18.6% |
10/26 | 11:00 | 8.2 | 108.3 | 98.1 | 1.35 | 11.3% | 15.4% | 17.1% |
10/27 | 09:15 | 8.2 | 102.6 | 92.9 | 1.27 | 11.5% | 14.6% | 14.2% |
10/27 | 13:25 | 8.2 | 128.8 | 115.2 | 1.61 | 12.7% | 20.5% | 15.7% |
10/28 | 16:30 | 8.2 | 141.0 | 126.7 | 1.78 | 12.1% | 21.5% | 14.2% |
10/29 | 15:20 | 8.2 | 109.3 | 98.3 |
|
|
| 13.3% |
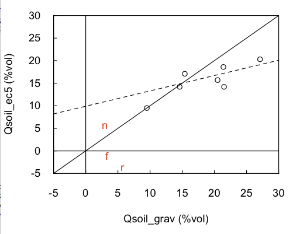
Here is a plot of these data, along with a 1:1 line and a linear regression to all but the first sample (when the EC-5 might not have been settled in). The regression line has an intercept of 9.9% and a slope of 0.34. Also shown are the 3 gravimetric samples at far (f), near ![]() , and flr (r). It was my intent that this slope would be applied to all of the METCRAXII Qsoil measurements, and to have the offset computed from the 1 gravimetric sample at each site.
, and flr (r). It was my intent that this slope would be applied to all of the METCRAXII Qsoil measurements, and to have the offset computed from the 1 gravimetric sample at each site.
With this philosophy, the adjustments are:
actual = (far + 2.3)/0.34
actual = (near - 4.4)/0.34
actual = (flr + 5.8)/0.34
actual = (base - 9.9)/0.34
The project measurements agree with these numbers reasonably well. However, near still goes negative at times, far goes negative one night, and flr goes over 61% during one rain event. Thus, I think that the 0.34 slope model above is not correct.
Subtracting only 7.6 (rather than 9.6) from flr makes the agreement quite good. Next, would be to check Cvsoil to see if sensor gains are consistent?
Using the in-field Qsoil adjustment (just a one-point bias correction), I see:
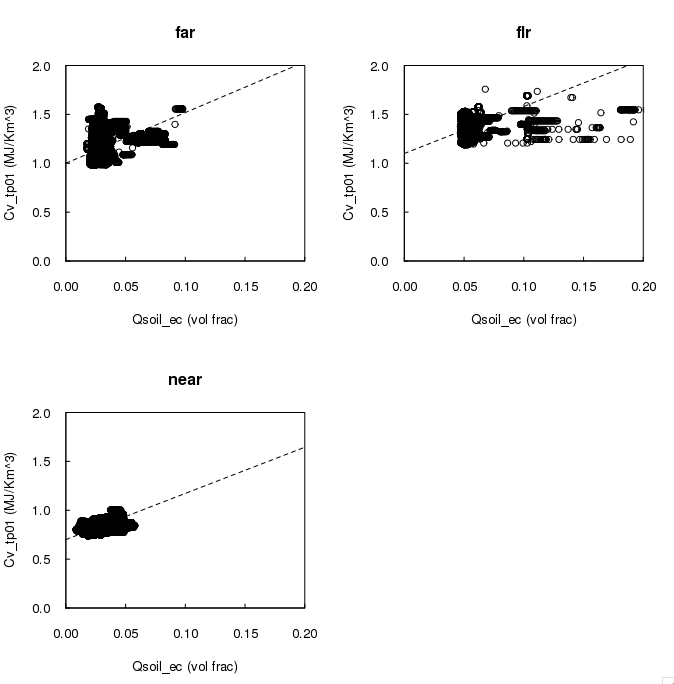
In this plot, I have placed an eyeball fit of a line with a slope equal to Cv_h2o through the data. Only at near is a systematic variation seen of Cv with Qsoil. If anything, the near plot has (slightly) too low a slope (Qsoil gain too high). I would say that this plot does not justify increasing the measured Qsoil values by a factor of 3.
To conclude:
- The test at base suggested increasing the Qsoil gain by a factor of 3. However, applying this correction to the site values makes negative values, too large flr values, and worse comparisons with Cvsoil from the TP01.
- The one-point in field adjustment of just the bias has none of these problems, though flr then is consistently larger by ~2%.