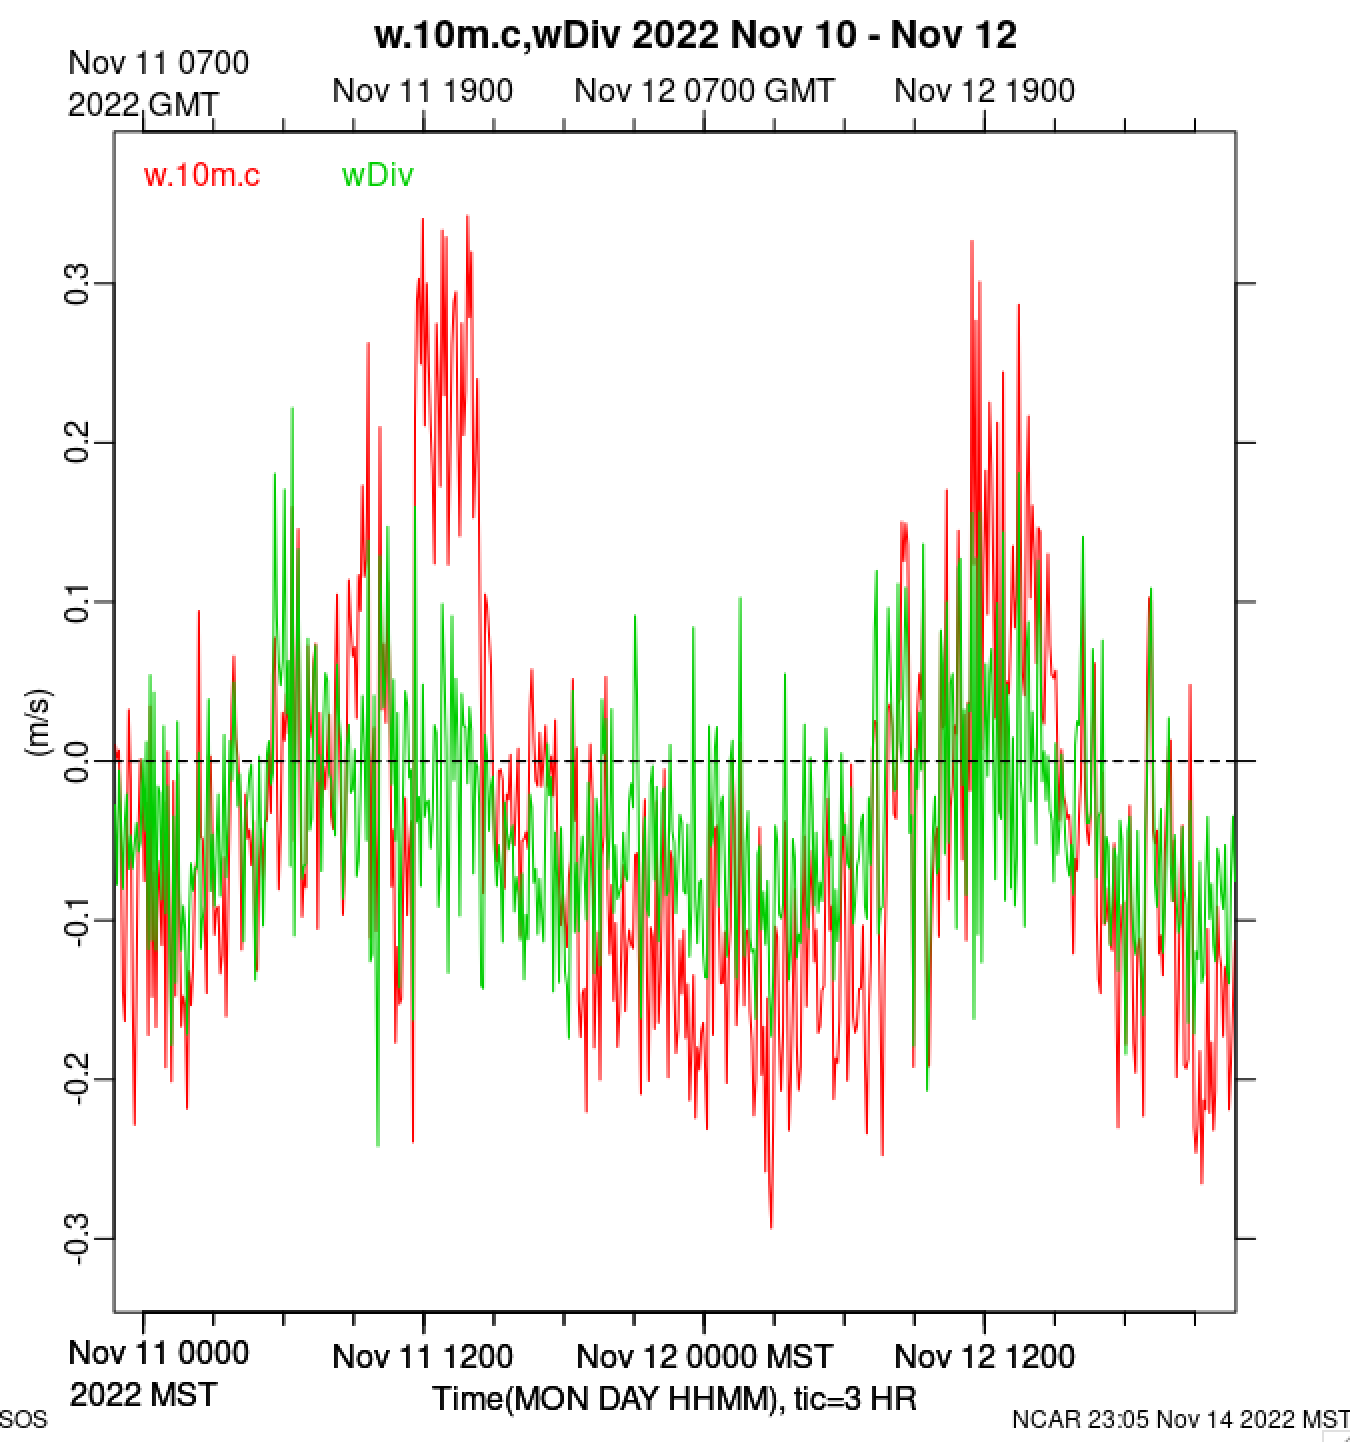
I'm intending to make this a standard daily plot, but just to try, here is a comparison between the average of the 4x vertical velocities at 10m (red) with the vertical velocity computed from the divergence of the velocities measured along the sides of the triangular prism defined by the d, uw, and ue towers. I've weighted the 1, 3, and 10m measurements by 2m, 3.5m, and 4.5m, respectively, in the vertical, averaged the horizontal velocity components from the two towers that define each side, computed the projection of the wind perpendicular to the orientation vector between the towers (as measured by the laser theodolite), and divided the computed sum of the flow through these 3 sides by the horizontal area of the triangle (green). Given the errors inherent in this calculation, I'm amazed by how well these measurements compare!