dpar(start="2012 Nov 12 00:00",lenday=20,stns=0,hts=3,sfxs="A8")
dataset("instrument")
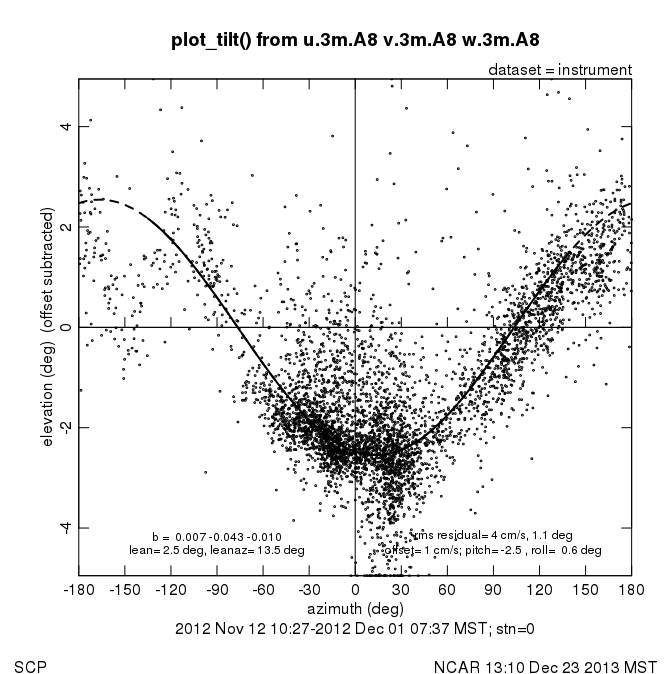
plot_tilt()
Added these values to geo_tilt_cor/irgason_a8.dat: woff=-0.01, lean=2.5, leanaz=13.5
Prior to deployment of the Handar sonics in the SCP field program, we tested the Handar 2D sonics in the EOL wind tunnel, which has a test section with a circular cross-section 1m in diameter. Wind speed and direction measured by the sonic were compared to tunnel speed measured by a pitot-static tube and wind direction measured by the orientation of the sonic in the wind tunnel. Each sonic was rotated through 360 degrees in 15 degree increments for tunnel speeds of 2, 5, 10, 15, 20, and 25 m/s. A subset of three sonics was also rotated in 3 degree increments.
The following table lists the gain, offset, and rms residuals (as a per cent of the pitot speed) from a least-squares fit of the sonic speed as a function of the tunnel (pitot) speed,
sonic speed = gain x pitot speed + offset.
The last column lists the rms residuals of a linear fit of sonic direction as a function of sonic orientation in the wind tunnel.
| SN | Date | spd gain | spd offset | spd rms | dir rms |
|---|---|---|---|---|---|
| 00194 | 8/20/12 | 1.04 | -5 cm/s | 3% | 0.5 deg |
| 00678 | 8/15/12 | 1.03 | -4 cm/s | 3% | 0.8 deg |
| 00719 | 8/13/12 | 1.04 | -6 cm/s | 3% | 0.9 deg |
| 01528 | 8/14/12 | 1.03 | -4 cm/s | 3% | 0.8 deg |
| 01627 | 8/16/12 | 1.03 | +4 cm/s | 3% | 0.9 deg |
| 01627 | 8/21/12 | 1.03 | -3 cm/s | 3% | 1.1 deg |
| 01631 | 8/14/12 | 1.03 | -4 cm/s | 2% | 0.8 deg |
| 01660 | 8/13/12 | 1.03 | -4 cm/s | 3% | 0.8 deg |
| a0730003 | 8/15/12 | 1.03 | -4 cm/s | 3% | 1.9 deg |
| y384003 | 8/14/12 | 1.03 | 0 cm/s | 2% | 2.8 deg |
