I've been trying to figure out why the Qsoil/Csoil comparison has looked lousy at most sites. What I've found:
1. I now have better values for the soil densities than my first cut at looking at the data (which only used the first set of gravimetric measurements).
2. The soil motes apparently had a "watchdog timeout" that reset power on the soil sensors rather frequently. I believe that this occurred at all sites sometime, and, when bad, happens every ~4hours:50minutes. Each time, the TP01 reported values of 0 until it was able to take another reading. These 0 values were averaged in to each TP01 variable, generating lots of spikes. A range check on the TP01 Vheat and Tau63 values has now been added to eliminate these zeros. The covars are being rerun now.
(Note that gaps of one sample (5 s) every 5-minutes are normal, as John's code uses this time to sample the mote's power voltage.)
3. Even with all this, the comparison is good at only about 1/2 of the sites. ("Good" means that the change of Cvsoil with Qsoil follows what I would expect. "Bad" means that Cvsoil changes more than I would expect.) I can trace the bad values to Vpile.on being too low at many of the sites. (asoil values seem reasonable at all sites and Vpile.off and Vheat -- the only other variables in the Lambdasoil calculation -- are okay.) This is true at most of these sites even during the last half of January, when there was a warm period that might have thawed the soil. Possible reasons for Vpile.on being low are:
a. Inadequate contact between the probe and soil (the most likely culprite, despite my best efforts)
b. Voltage drop on Vheat (unlikely, since the 4-wire probe should measure this)
c. Electrical contact problem on Vpile (unlikely, but should be checked)
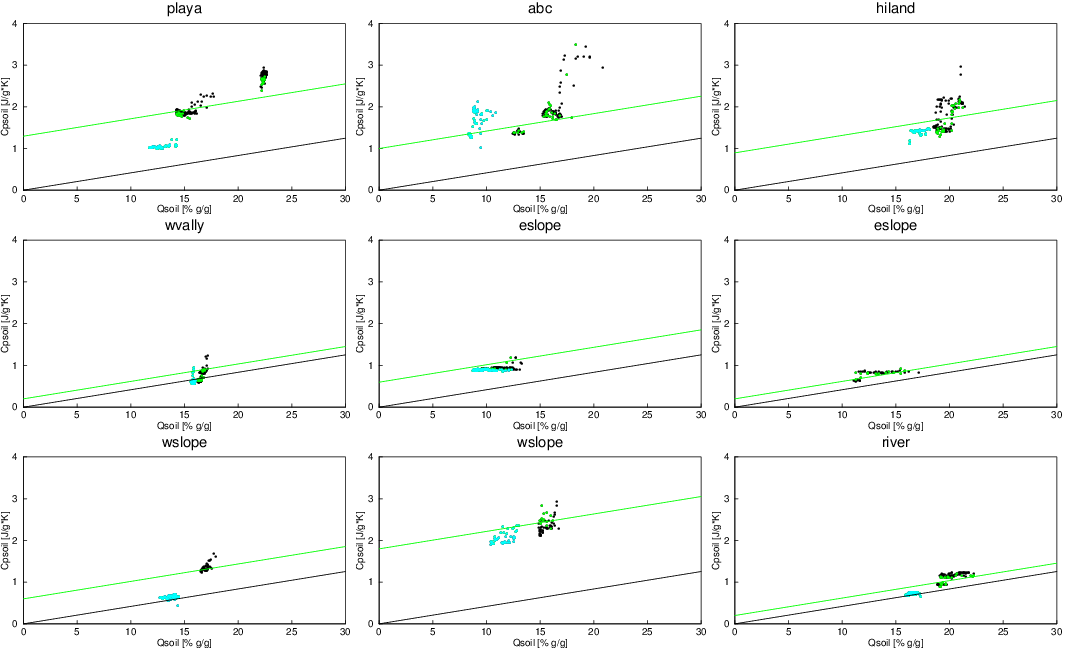
d. Heat going into latent heat of fusion (melting mixed-phase moisture), rather than sensible heat (can partly check by looking at warm periods -- a new idea for me). [The results of this check are not very convincing -- see below plot.]
This is closer than I've been before with this comparison, but I still have a long way to go.
Attached is my current comparison plot for each of the 9 soil sites after filtering the statistics for:
- good Tau63 and Vheat values
- rerun of covars over first half of the data
- removing qsoil values when tsoil<0C
Points in blue are for the first month of the project, when probes may have been settling (actually, mostly not too bad). Arguably, these values may be ignored. Points in green are for tsoil>5C, when soil should not have ice. The line is the expected variation of Cvsoil with Qsoil (4.184 J/kgK for 100% soil moisture by mass) with no dry soil heat capacity. Actual values should fall along a line parallel to (and above) this line.