tower base
39.100585N
105.105618W
S.W. anchors
39.100595N
105.105905W
39.100578N
105.105776W
S.E. anchors
39.100432N
105.105384W
39.100316N
105.105247W
N. anchors
39.100678N
105.105425W
39.100806N
105.105431W
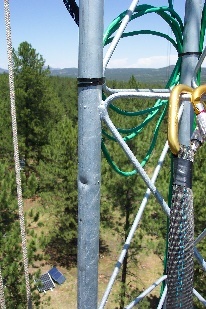
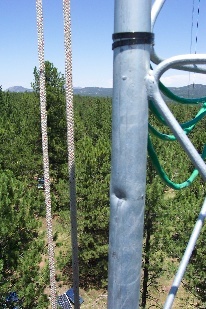
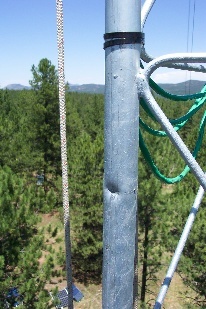
Found these photos of the damage to the tower. The tower was fixed on Nov 6, 2009, https://wiki.ucar.edu/x/DhAFAw
Photos of Tower damage |
||
|---|---|---|
|
|
|

August 17, 2013
All remaining brackets, booms and deer stands have been removed from Turb Towers. What remains is a beacon, two levels of lightning protection.
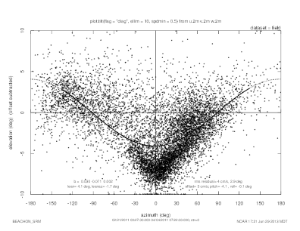
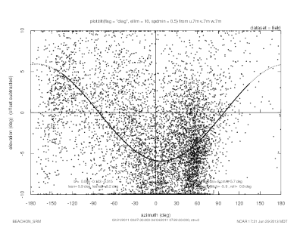
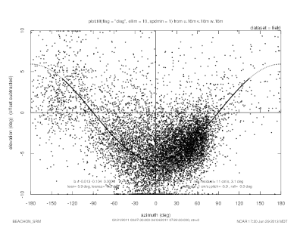
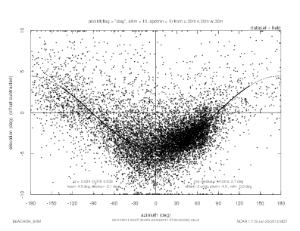
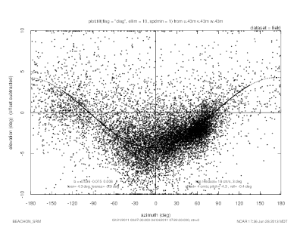
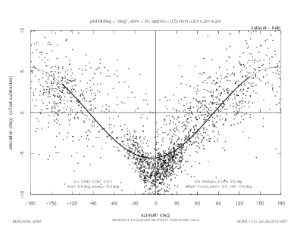
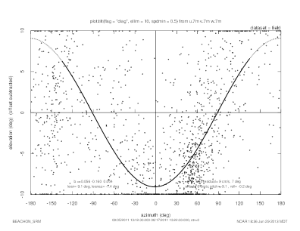
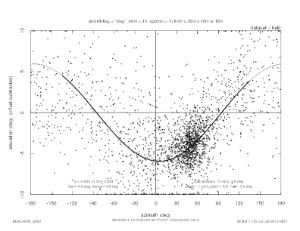
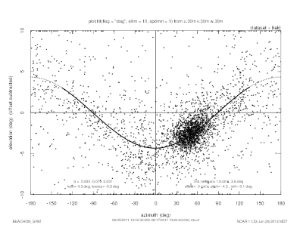
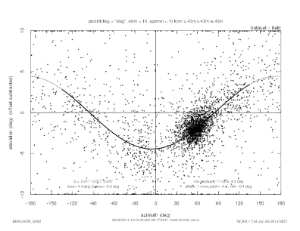
The following plots were made with our Splus function, plot.tilt, that does a linear least squares fit to find the plane of mean flow, and plots the wind vector elevation angle vs azimuth. The planar fit becomes a sine curve on the tilt plot.
See EOL sonic tilt documentation.
From a long term plot of the sonic "diag" value, I chose two periods where the the values were consistently very small. plot.tilt discards 5 minute wind averages when "diag" is above 0.01, or more than 1% of the data has a non-zero CSAT3 diagnostic value.
For the upper sonics at 16, 30 and 43 meters, the minimum wind speed used for the fit was 1.0 m/s. For the lower sonics at 2 and 7 meters, the minimum wind speed was set to 0.5 m/s. This didn't have much effect on the fit, however.
Feb 21 to April 4, 2011
2 meters
7 meters
16 meters
30 meters
43 meters
Aug 5 to Aug 17, 2011
date |
height (m) |
lean |
leanaz |
w offset (m/s) |
elevation residual rms (deg) |
offset residual rms (m/s) |
notes |
|---|---|---|---|---|---|---|---|
Feb-Apr 2011 |
2 |
4.1 |
-1.7 |
0.03 |
2.9 |
0.04 |
|
|
7 |
5.9 |
8.2 |
0.07 |
5.7 |
0.08 |
|
|
16 |
5.9 |
-0.2 |
-0.01 |
3.1 |
0.011 |
|
|
30 |
4.5 |
-2.1 |
0.02 |
2.7 |
0.014 |
|
|
43 |
4.3 |
-5.9 |
0.04 |
3 |
0.02 |
|
Aug 2011 |
2 |
5.6 |
-6.3 |
0.04 |
2.6 |
0.03 |
|
|
7 |
9.1 |
-1.4 |
0.06 |
7 |
0.09 |
large tilt value, too much scatter for good fit |
|
16 |
5.9 |
4.6 |
-0.01 |
3.6 |
0.01 |
|
|
30 |
4.3 |
-0.9 |
0.00 |
3.6 |
0.01 |
|
|
43 |
4.4 |
-5.5 |
0.01 |
4.2 |
0.02 |
|
Tom says that typical droop of sonic booms results in 1 to 2 degree tilts. The sonic booms point up-slope from the tower, so the approximate 5 degree tilts seen here are a combination of the boom "droop" and the slope of the terrain.
They generally agree on an approximate 5 degree tilt of the sonics relative to the mean flow, except the 9.9 degree tilt for the 7m sonic in Aug 2011.
There appears to be some local "disturbance in the force", causing a pinched effect at 2 meters, and to a lesser extent at 7 meters, so that winds straight into the sonic have an additional downward inclination.
There seems to be good agreement at 16 meters and above between the two fits. I suggest using the average of the two values for those levels. Perhaps we need to look at more data for 2 and 7 meters.
dpar(start="2011 2 21 00:25",end="2011 4 4 07:26",coords="instrument")
dpar(hts=2)
plot.tilt(flag="diag",ellim=10,spdmin=0.5)
As a test of whether a 3G cellular modem could replace the WIFI network connection at Manitou Forest Observatory, I've setup a titan DSM in my office, with a Cradlepoint CTR350 router and a Verizon USB720 modem. The modem uses an external antenna (6" dipole) in the window of my office.
The modem's signal strength can be viewed from the Modem->Info page of the router's WWW interface. It is currently showing a 92% signal strength at -79 dBm:
Name	Value
Manufacturer: 	Novatel Wireless Inc.
Model Info: 	MC760 VERIZON
Modem Firmware Version: 	Q6085BDRAGONFLY_V139 [Jul 02 2009 18:00:00]
Carrier Status: 	UP
ESN/IMEI: 	5B4F86F2
Mobile Directory Number: 	7204707887
Connection Type: 	CDMA
PRL Version: 	53013
Signal Strength (%): 	92
Signal Strength (dBm): 	-79
PhysicalPort	USB1
Connection Status: 	Connected
CTR350 serial number: MM090168701586
CTR350 MAC: 00 30 44 06 bc 0f
Crontab entries check the status of the ethernet and Verizon link, and can power cycle the router if necessary:
# Only run router_check.sh if net_check.sh succeeds to avoid power cycling modem if the problem is with t
he ethernet connection
1,31 * * * * net_check.sh eth0 192.168.0 192.168.0.1 && router_check.sh 8 www.eol.ucar.edu www.google.com
# Every 4 hours, run router_check.sh by itself, in case the router needs
# power cycling to get the ethernet working
10 */4 * * * router_check.sh 8 www.eol.ucar.edu www.google.com
Rsync transfers from the Titan to FLAB are running at about 61 KB/sec. This was a transfer with compression enabled, of binary files (shareable libraries):
sent 294 bytes  received 5998216 bytes  61523.18 bytes/sec
total size is 16029060  speedup is 2.67
Transfers the other way are about 85 KB/sec:
sent 5998221 bytes  received 214 bytes  85084.18 bytes/sec
total size is 16029060  speedup is 2.67
Remote Admin
Remote admin is enabled on port 30080 from all hosts with 128.117 IP addresses. However I have not been able to successfully get past the login screen. After entering the password, nothing more appears. Firefox status bar says "Transfering...". tcpdump shows packets arriving from port 80 of isfs4.dyndns.org, but nothing is rendered. Cradlepoint tech help says it is because the signal strength of -80 dBm is too low, that it needs to be up around -65 to -70. He says he did get past the login screen, but I have never been able to. I'm dubious. Maybe its a Firefox thing? Steve Oncley just tried Chrome and Safari. No luck.
With the system outside, the signal strength showed as 96%, -77 dBm, but still remote admin would not work.
Power Supply
The power supply consists of the following in a cooler box:
- Power-One HB12 supply, 12V, 1.7A
- Morningstar Sunguard charge controller
- Panasonic lead-acid, 12V, 7.2 Ah battery
On Mar 12, started testing the whole system, modem, router, DSM and power supply in the back lot of FL1 near the yard maintenance shed. Will watch the voltages to see that the HP12, controller and battery can keep up.
Kurt felt the values on 3/13 were too low to maintain a healthy battery, so he turned a pot on the charger to increase the voltage. The values for 3/14 are much better.
Date |
HB12 Output |
Battery |
|---|---|---|
3/13 |
12.1 V |
12.08 V |
3/14 |
14.2 V |
13.7 V |
Installed
On March 21, at 11:55 MDT, John Ortega installed the system at Manitou. It came up and is online, and has registered with DynDNS as mfogw.dyndns.org. It is mounted on the scaffolding tower, next to the Skybeam WIFI. A little 6" dipole antenna is connected to the Verizon modem. He attached a grounding strap from the gray DSM box to the tower. There is an ethernet surge protector inside the box to provide protection on the ethernet cable coming up the tower, once it is connected. A GPS is on port 3 and NTP looks good.
Here is the current network configuration. Note that it is not connected to the rest of the MFO network at this time.
host |
address |
|---|---|
Cradlepoint router |
192.168.0.1 |
RAL server |
192.168.0.5 |
DSM |
192.168.0.10 |
The RAL server at 192.168.0.5 is configured as the DMZ host - the Cradlepoint should pass all traffic, except those ports otherwise forwarded, to the RAL server.
September 28, 2012
Chris and Lisa
All equipment has been removed from the Turbulence Tower. Three sonics, two Licors, five TRHs, barometer, 4-comp, dsm, ALL cables (except eth), batteries, charger.
Things that we kept there were all TRH booms, barometer boom, three sonics booms, CSAT electronic plates (3), 4-comp boom WITH mounting plate and deer stand.
Gear that is in EOL: Five TRHs, two sonic booms, three CSAT electronic plates, 4-comp, barometer, three batteries, power cable and splitters.
Most gear was sent to SCP due to lightening strike on September 27th. At this point I will go through cables and repair as much as I can with what supplies we have in the lab. Most cables need repair.
September 25, 2012
Afternoon
Chris and Lisa
Replaced barometer with another barometer. Do not know serial number on new unit. It is coming in but not parsed the same.
Removed sonic at 8m and 30m.
From my reading of the logbook, the licors were at these heights, starting at the given dates:
level |
Nov 18, 2009 |
Dec 2, 2009 |
Feb 2, 2010 |
Mar 29, 2011 |
Apr 12, 2011 |
Oct 14, 2011 |
Dec 15, 2011 |
Jun 26, 2012 |
Aug 15, 2012 |
|---|---|---|---|---|---|---|---|---|---|
2 |
0813 |
|
1163 |
removed all, |
1166 |
1166 |
1166 |
removed all, |
0813 |
7 |
1166 |
1166 |
1166 |
|
|
0813 |
|
|
|
16 |
1167 |
1167 |
1167 |
|
1163 |
1167 |
0813 |
|
1164 |
30 |
1163 |
1163 |
|
|
|
|
|
|
|
43 |
1164 |
1164 |
1164 |
|
1164 |
1164 |
1164 |
|
1166 |
Failures:
Summer 2009: SN 0813, 1166 fixed at Licor after lightning damage prior to being deployed at Manitou.
Oct 2, 2011: 16m, SN1163, https://wiki.ucar.edu/x/cKmrB
Nov 6, 2011: 16m, SN1167, https://wiki.ucar.edu/x/jofpB
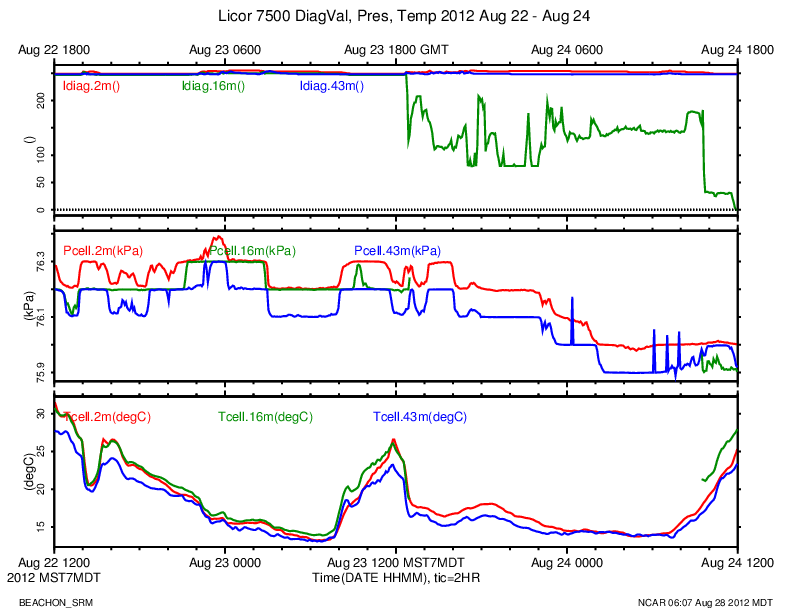
Aug 23, 2012: 16m, SN1164, https://wiki.ucar.edu/x/boHCBg
According to https://wiki.ucar.edu/x/HwClBg, the 16m licor is SN1164.
http://www.eol.ucar.edu/isf/projects/BEACHON_SRM/isfs/qcdata/plots/2012/08/23/licor_20120823.png
On Aug 23 18:48:30, the diag initially dropped from a good value of 249 to 118-121.
2012 08 23 18:48:30.5894 0.1001 49 249\t0.07072\t12.6021\t0.05373\t415.742\t19.45\t76.2\t\n
2012 08 23 18:48:30.6894 0.1 49 249\t0.07068\t12.6090\t0.05378\t416.812\t19.45\t76.2\t\n
2012 08 23 18:48:30.7894 0.1 49 121\t0.07176\t12.6058\t0.00112\t418.920\t19.45\t76.2\t\n
2012 08 23 18:48:30.8893 0.09994 49 119\t0.06758\t12.5810\t0.00463\t435.376\t19.45\t76.2\t\n
2012 08 23 18:48:30.9893 0.09998 48 118\t0.06661\t12.4256\t0.01945\t-6.373\t19.43\t76.2\t\n
2012 08 23 18:48:31.0896 0.1003 48 118\t0.06405\t11.7233\t0.03659\t56.809\t19.45\t76.2\t\n
2012 08 23 18:48:31.1894 0.09977 49 118\t0.06470\t11.6094\t0.04970\t170.629\t19.45\t76.2\t\n
2012 08 23 18:48:31.2893 0.09994 49 118\t0.06822\t11.0511\t0.06201\t287.164\t19.43\t76.2\t\n
After the number of bytes (49 or 48) is the licor data record. The data fields (diag,co2raw,co2,h2oraw,h2o,Tcell,Pcell) are separated by tabs (\t)
A diag of decimal 118 is binary 01110110, where bits 0,3 and 7 are 0.
bits 0-3 are the AGC, automatic gain control. The critical diag bits are 4-7.
See: ftp://ftp.licor.com/perm/env/LI-7500/Manual/LI-7500Manual_V4.pdf, page 3-36.
Bit 4 is Sync:
Sync Flag - If not OK, indicates that the LI-7500 embedded software and the digital signal
processor (DSP) receiving the signal from the chopper motor in the sensor head are out of
sync. Check cabling.
Bit 5 is the PLL:
PLL - Phase Lock Loop offset, indicates the status of the chopper motor. If not OK, there
may be a problem with the chopper motor in the sensor head.
Bit 6 is the detector:
Detector - If not OK, indicates the detector cooler is not maintaining the proper temperature:
this will happen at temperatures above 50 °C. Note that this does not always indicate a
serious problem; the cooler may simply have not yet reached the target temperature during
instrument startup, or it may be out of range due to external environmental conditions.
Readings may still be OK. Check cables and wiring.
Bit 7 is the chopper:
Chopper - If not OK, indicates the chopper temperature controller is out of range, hot or cold.
As with the Detector indicator above, this may or may not indicate a serious problem. The
chopper should be able to temperature control when ambient is between +50 and -25 °C.
Since Aug 23, the diagnostic value has been all over the map, with bits 5,6,7 changing over the day.
Here's a snippet of data from Aug 30. Diag=159, binary 10011111, bits 5 and 6 are 0 (not OK), bits 4 and 7 are OK.
159\t0.84090\tOverflow\t0.85015\tOverflow\t30.04\t76.3\t\n
159\t0.14794\tOverflow\t-0.15488\tOverflow\t30.04\t76.3\t\n
159\t0.74279\t1034826496\t0.88954\tOverflow\t30.06\t76.3\t\n
I think Tcell and Pcell have always looked OK.
August 17, 2012
10:00am - 1:30pm MDT
Three batteries installed at Turbulence Tower. Four component was installed and working. New TRH 2m top plate. New 2m sonic (CSAT0536) was installed to replace odd sonic.
August 15, 2012
10:30am - 3:00pm
Putting freshly calibrated sonics (CSATs) on turbulence tower with Licors, TRHs and barometer. The four-component radiation did not get mounted due to a mount missing. System was check with just a charger powering instruments but then shut off due to missing batteries. Everything looks good but the 2m sonic.
Guy tensions were checked.
Remember: Batteries, radiation mounting plate, radiation instrument, boom and electronics box.
45m: CSAT0537, Licor 1166
30m: CSAT0853
15m: CSAT0539, Licor 1164
7m: CSAT0800
2m: CSAT0855, Licor 0813
Aug 23, 11:30 am
Installed a new kernel with one small difference in the PC104 interrupt handling. If the PC104 interrupt hander is called, and it sees no bits set in the pending value, then it goes ahead and call handlers for all unmasked PC104 interrupts (which in manitou's case is just one, IRQ 3).
This logic was also in the patched 2.6.16 kernel. It counted these "spurious" interrupts and from time to time, complained about them. The new code doesn't log any complaints. The intcount script could be used to see if it is happening frequently.
Since re-installing the data system last week, with the new kernel, I've seen a few timeouts where all data from the emerald cards cease. This patch may help that.
The data system was re-installed on Aug 15. It is the same hardware (CPU, serial cards, usb disk, enclosure and interface panels) as before.
The Linux kernel has been upgraded, from 2.6.16 to 2.6.35. This kernel has PPS support, so an extra patch was not needed to get the PPS from the GPS. It also does not have the bug where executables could not be run from compact flash. Therefore they are not copied to ram disk at bootup.
This kernel also sets the PC104 CPLD to do the default linux-style interrupt handling, where AUTO_CLR and RETRIG are not enabled as before. The GPIO interrupt that serves the PC104 is now an edge detect interrupt. It has a patched handler for the edge detected interrupts.
The Licors are also modified with a fix that was found when testing at FLAB. Because the CTS line into the DSM was allowed to float,then it generated interrupts over a long cable. They occur when the TX line from the Licor is active, so it must be some sort of cross talk. It is not simple to disable CTS interrupts in the kernel. Instead, the CTS to the DSM was looped back to RTS from the DSM in the Licor box and not allowed to float. The Licor CTS was already looped back to its RTS in the box, so this is a symmetrical loopback.
We shouldn't see any of the "spurious interrupt" messages, primarily because the kernel now doesn't complain about them, but also since we are not getting the storm of CTS interrupts, then things should be much more predictable.

Just flipping through the data, have noticed what appears to be a nice sweep event (upper air intrusion into the canopy) at about 2011 Oct 5 23:30*.*
June 26, 2012
11:00am - 2:05pm MDT
Removal of all sensors on the Turbulence Tower today. Sonics, Licors, TRHs, pressure, four-component, batteries and dsm. Cables have remained on tower. Kept beacon on also.
Since we left cables on tower we had to mark cables on the dsm side so we know what instrument it was and which port. This was our organization codes using colored paper clips, zip ties and electrical tape. All levels have a sonic, TRH and Licor which are bundled together. This is the code for the bundle.
CSAT marked with zip tie
TRH marked with tape
Licor marked with nothing.
Heights are marked with paper clip colors.
45m - Green
30m - Pink
15m - Blue
8m - Yellow
2m - White
Additional random cables.
Ethernet - 1 SMALL zip tie, no clip
Rad22m - 2 SMALL zip ties, no clip
Pressure - 3 SMALL zip ties, no clip
dsm was taken down at 11:35am.
WE NEED PRESSURE TUBING!
We have all the sensors and the data system running in the staging area. We've added one Licor 7500 to what was last on the tower, for a total of 4 Licors. The data cables, and Licor power cables are different however, since the originals were left on the tower.
After setting it up, I increased the 4 Licor 7500s from 10 samples/sec at 9600 baud to 20 samples/sec at 19200 baud.
The spurious interrupts are happening, sometimes spiking to above 100:
Jun 28 21:27:02 manitou kernel: viper_irq_handler: irq=2 spurious= 326001, #/sec=102
Jun 28 21:27:21 manitou kernel: viper_irq_handler: irq=2 spurious= 328001, #/sec=109
Jun 28 21:29:06 manitou kernel: viper_irq_handler: irq=2 spurious= 338001, #/sec=102
Jun 28 21:29:46 manitou kernel: viper_irq_handler: irq=2 spurious= 342001, #/sec=106
Jun 28 21:29:56 manitou kernel: viper_irq_handler: irq=2 spurious= 343001, #/sec=102
Jun 28 21:30:38 manitou kernel: viper_irq_handler: irq=2 spurious= 347001, #/sec=103
Jun 28 21:30:48 manitou kernel: viper_irq_handler: irq=2 spurious= 348001, #/sec=101
Jun 28 21:31:28 manitou kernel: viper_irq_handler: irq=2 spurious= 352001, #/sec=111
Jun 28 21:31:58 manitou kernel: viper_irq_handler: irq=2 spurious= 355001, #/sec=104

root@manitou root# uptime
 21:44:36 up  1:43,  1 user,  load average: 0.16, 0.11, 0.09
The kernel issues a "spurious" message when they occur more often than 100/sec. The system came up at 21:44 - 1:43 = 20:01. At the time of the last message above, the system had been up for 1 hour 31 minutes. 355001 interrupts in 1 hour 31 minutes averages to 65/sec.
The above test is with the same kernel (2.6.16.28-arcom1-2-viper #1 PREEMPT Wed Sep 16 17:04:19 MDT 2009) and CPU (viper 4) as was deployed on the tower.
manitou:/dev/ttyS9           1     20        14 2012 06 28 23:13:12.975  06 28 23:13:26.005    1.00  0.938  1.043   19   19
manitou:/var/tmp/gps_pty0    1     30        29 2012 06 28 23:13:12.574  06 28 23:13:26.574    2.00  0.154  0.882   72   73
manitou:/dev/ttyS1           1    100       285 2012 06 28 23:13:12.624  06 28 23:13:26.820   20.01  0.046  0.054   12   12
manitou:/dev/ttyS5           1    120        15 2012 06 28 23:13:12.893  06 28 23:13:26.489    1.03  0.965  0.979   30   30
manitou:/dev/ttyS6           1    200       285 2012 06 28 23:13:12.654  06 28 23:13:26.852   20.00  0.044  0.058   12   12
manitou:/dev/ttyS7           1    210       285 2012 06 28 23:13:12.619  06 28 23:13:26.814   20.01  0.042  0.059   56   56
manitou:/dev/ttyS8           1    220        14 2012 06 28 23:13:13.516  06 28 23:13:26.256    1.02  0.974  0.986   29   29
manitou:/dev/ttyS10          1    300       285 2012 06 28 23:13:12.652  06 28 23:13:26.854   20.00  0.041  0.061   12   12
manitou:/dev/ttyS11          1    310       285 2012 06 28 23:13:12.621  06 28 23:13:26.825   19.99  0.045  0.056   49   49
manitou:/dev/ttyS12          1    320        15 2012 06 28 23:13:13.098  06 28 23:13:26.775    1.02  0.971  0.986   29   29
manitou:/dev/ttyS19          1    330         3 2012 06 28 23:13:10.785  06 28 23:13:20.787    0.20  5.000  5.002   56   56
manitou:/dev/ttyS13          1    400       285 2012 06 28 23:13:12.658  06 28 23:13:26.858   20.00  0.046  0.054   12   12
manitou:/dev/ttyS14          1    410       286 2012 06 28 23:13:12.593  06 28 23:13:26.845   20.00  0.047  0.052   49   49
manitou:/dev/ttyS15          1    420        14 2012 06 28 23:13:13.374  06 28 23:13:26.024    1.03  0.969  0.980   30   30
manitou:/dev/ttyS20          1    500       286 2012 06 28 23:13:12.622  06 28 23:13:26.869   20.00  0.047  0.053   12   12
manitou:/dev/ttyS17          1    510       285 2012 06 28 23:13:12.619  06 28 23:13:26.824   19.99  0.042  0.058   49   49
manitou:/dev/ttyS18          1    520        14 2012 06 28 23:13:13.284  06 28 23:13:25.990    1.02  0.970  0.984   30   30
Gordon Jun 27, 2012
After removing the sensors and data system, we're testing the set up back in Boulder, to see if we can duplicate the problem of not being able to sample 5 licors.
In setting up the test, noticed that the fan on TRH012 does not run, but the TRH does output data. Checking the data archive, that unit is data id 1,420, which was the 30 meter TRH. Will check with Chris in case he noticed whether the fan was running when he removed the sensor.
If the fan was out while the unit was on the tower, then T,RH at 30m data should be treated with suspicion. By looking at the profiles, one might be able to determine when the fan went out.
According to Ned, it is very likely that the fan connection was damaged when the unit was removed from the tower.
The entire turbulence tower was down from May 31 until June 8. During this time, we were able to ping the datalogger but unable to log in. Richard Oakes from the USFS cycled the power on the datalogger at about 2pm on June 8, which restored access to the system.
All sensors came happily back to life, with the exception of the 2m LiCor that Gordon was able to resuscitate via sending ASCII commands to the sensor.
Comments added by Gordon:
From a phone conversation with Richard Oakes: He recalled a hail and lightning storm in the vicinity of the MFO during the afternoon and early evening of May 31, and that his wife noticed a lightning strike that she thought was in the vicinity of the turbulence tower that afternoon. His record indicates just 0.01 inch of precip on May 31.
To bring back the 2m licor, I used the commands shown in https://wiki.ucar.edu/x/CAK9B:
adn
minicom ttyS2
ctrl-a w  (enable line wrap)
ctrl-a e  (enable local echo)
ctrl-a f  (send BREAK)
(Outputs (BW 10) (Delay 0) (RS232 (Freq 10.0)))
ctrl-a q
aup
The turbulence tower data had not been updating since March 17. A site visit by Ned found that the network issue preventing communication was associated with the 5-port Linksys/Cisco switch located in the waterproof power enclosure at the tower. Cycling the power on the switch brought back the network.
Who: Ned, Christopher
When: December 15, 2011. Arrived 9:51am, Departed 12:00pm
Removed Licor (sn 1176) from 15m.
Note, by Gordon, Jul 13, 2012: There is no sn1176. I think this must have been unit sn1167, which according to the log entry of 4/12/2011, was installed at 15m.
When removing this sensor due to bad chopper motor, it was not running. Rebooted sensor and heard the chopper motor in the head and it sounded bad. Removed the 7m Licor (sn0813) and taped up connections and moved this Licor to the 15m height. Plugged in all connections as normal (signal green cable and power through BNC). All looked (and sounded) great. Replaced the TRH fans at heights 7m and 15m. Both fans sounded REALLY bad. The 2m TRH fan did not sound very good either. Guessing we will be replacing that fan soon.
*Did notice that when the Licor 1176 was at 15m and before removal I checked power at the inside green connector. Voltage was going from 12.9V to 11.4V every six seconds. Odd cycle, but this also seemed odd in general. Checked the power at the 7m height when removing that Licor and it had the same cycle but not as drastic. Took a voltage reading at dsm, voltage was cycling. Took reading at battery bank and did see the cycle but not as drastic. Noticed the battery charger was pulsing to charge the battery bank. It was on the 'deep cycle'. We switched charger to 'conventional cycle' and it all stopped. No more voltage swings. We also wanted to know why the batteries were not taking out that pulsing to the tower. One of the batteries must be bad or wrong charger for batteries. We unplugged the charger to see what the load did on the batteries, checking for bad battery. In 15minutes we dropped from 13.10V to 12.47V. Not much of a drop. Leaning to more of the wrong charger cycle and will monitor the battery bank on this current setting.
15 m Li-COR (sn1176) dropped out of service on November 6, 2011.
Note, by Gordon, Jul 13, 2012: There is no sn1176. I think this must have been unit sn1167, which according to the log entry of 4/12/2011, was installed at 15m.
The diagnostic value dropped to 215 indicating that Bit 5 signaled that the instrument's chopper motor failed. There was an indication a number of hours earlier that the chopper motor was beginning to fail, see:
http://www.eol.ucar.edu/isf/projects/BEACHON_SRM/isfs/qcdata/plots/2011/11/06/licor_20111106.png
Chris and I made a trip to MFO to move the 7m Li-COR (sn 0813) up to 15m and to remove the dead instrument from 15m. The tower is therefore operating again with three levels of water vapor and CO2 fluxes (2m, 16m, 43m). See Chris' entry for details of this instrument swap and timing.
Gordon, Dec 9 3:15 pm
Since Dec 1 22:50 UTC the DSM log file (/var/log/isfs/adam.log) has error messages that the GPS pseudo-terminal device, /var/tmp/gps_pty0, does not exist. Apparently the tee_tty process died at that time.
tee_tty reads the GPS ASCII messages on /dev/ttyS3, and writes them to two pseudo-terminals /dev/gps0 (read by NTP) and /var/tmp/gps_pty0 (read by dsm).
I'm not sure why tee_tty died, but decided that this was an opportunity to upgrade the NIDAS software on this system. The existing version was 5810M, current as of Nov 9, 2010.
Installed the latest and greatest, version 6364.
During this time I noticed that characters were being lost in the ssh session, such that I had to enter characters twice for them to get to the shell if the dsm process was running. I have a faint memory of this happening before. Determined that this is due to tee_tty exiting, leaving the symbolic links to the pseudo-terminals around. The dsm process re-opens the /var/tmp/gps_pty0 every 10 seconds after an error, and so if sshd creates a pseudo-terminal and /var/tmp/gps_pty0 points to it, then the dsm process will be stealing characters from the ssh session. Did a dump of the GPS data and saw my shell commands! Hacked myself ![]()
Installed a new version of tee_tty, which will catch the HUP, INT and TERM signals, and clean up the symbolic links on exit. Tested it and things look good.
The "spurious" IRQ messages are annoying when one is logged onto the system console at the tower. They are logged at a priority of "warning". They should have a lower priority, like debug, or info, unless the number/sec is above some threshold. Until that change is made, I'll disable them on the console, by setting the "-c 4" option in klogd, which then suppresses messages of warning and lower, which are numeric values 4-8. 3-0 are priorities from error to emerg.
That change was made to /etc/init.d/klogd on Oct 24, 16:45 UTC, and klogd restarted.
To see the spurious messages, do either of the following:
cat /proc/kmsg
dmesg
cat /proc/kmsg removes the messages from the kernel message ring buffer as they are read.
Oct 14, 2011
Arrived: 9am MDT
Departed: 11am MDT
ChrisG and SteveS are on site to diagnose the sick licor 7500 at 16m and add the two licors that were at the CWEX11 project.
Chris could not hear the motor spinning on the 16m Licor 7500. A power cycle did not bring it back. While removing it, when the unit bumped against something, the motor started up, but was much more noisy than usual. It will be brought back for repair.
Installed SN 1167 at 16 meters, and 0813 at 7 meters. 30 meters still has no Licor.
From Boulder I (Gordon) set the sampling rate to 10 Hz and the baud rate to 9600. The Licors had been configured for 20 Hz, 19200 baud. From minicom, after adn:
adn
minicom ttyS7  (or ttyS11)
ctrl-a w  (enable line wrap)
ctrl-a e  (enable local echo)
ctrl-a f  (send BREAK)
(Outputs (BW 10) (Delay 0) (RS232 (Freq 10.0)  (Baud 9600)))
ctrl-a q
aup
They also swapped out the three main batteries.
Also checked tensions.
The data from the Licor at 16 meters went bad on Oct 2, while our system was not reachable over the network.
http://www.eol.ucar.edu/isf/projects/BEACHON_SRM/isfs/qcdata/plots/2011/10/02/co2_20111002.png
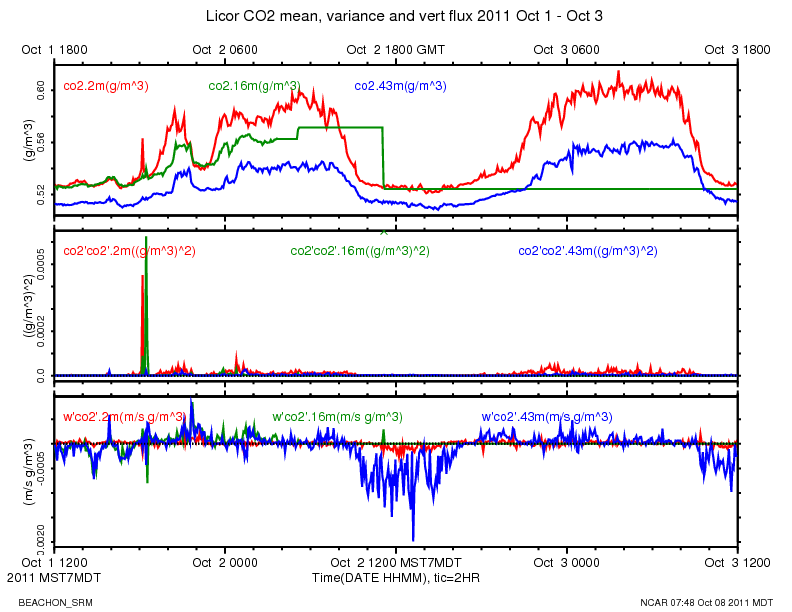
The ldiag averages went from the typical 248-255 range to around 216.
http://www.eol.ucar.edu/isf/projects/BEACHON_SRM/isfs/qcdata/plots/2011/10/02/licor_20111002.png
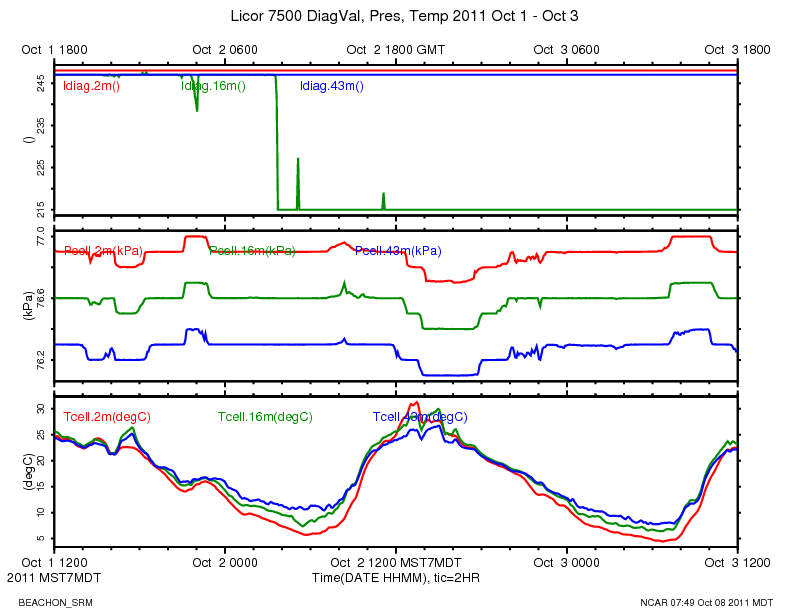
This CWEX11 logbook entry has some information about the licor diagnostic value:
This morning at around 10:40 MDT, I logged in and looked at the high rate data with rserial. (The 16 meter licor is serial port 11) The diagnostic value is 215 = 11010111 binary. Bit 5 is 0 indicating the PLL is not OK.
According to the manual:
PLL - Phase Lock Loop offset, indicates the status of the chopper motor. If not OK, there may be a problem with the chopper motor in the sensor head.
Also just noticed there is not data on the plots from the 2 meter licor since 04:00 MDT this morning. That appears to be a moisture issue. I just logged in and did rserial (serial port 2):
rs 2
255\t0.11124\tOverflow\t0.11690\tOverflow\t2.77\t76.0\t\n
255\t-45877.11718\tOverflow\t-37005.95312^D\tOverflow\t2.78\t76.0\t\n
255\t-59961.00781\tOverflow\t-110557.73437\tOverflow\t2.77\t76.0\t\n
255\t0.86791\tOverflow\t0.94173\tOverflow\t2.79\t76.0\t\n
The \t are tabs between the values. 255 is the ldiag value, indicating a high AGC value, but all other diagnostic bits are OK. The second and fourth values in a message are the raw values for co2 and h2o, which look crazy, and the calibrated values are "Overflow". This will probably clear up when things dry out.
We have not been able to reach the turbulence tower data system since Sep 29.
We could ping the RAL server in the seatainer from Boulder. Andy Gaydos logged into the server and could not ping the data system: 192.168.100.202. So either the data system or the network between the seatainer and the tower was down.
On Oct 6 I was able to ssh to the DSM. So somebody fixed the problem, or perhaps a fiber<->copper transceiver reset itself.
I did not see anything in /var/log/isfs/messages about eth0 going down/up.
The DSM did not go down, so it wasn't a DSM power problem:
root@manitou root# date
Thu Oct  6 22:44:24 GMT 2011
root@manitou root# uptime
 22:45:18 up 464 days,  3:22,  2 users,  load average: 0.02, 0.05, 0.00
Monitoring the accuracy of the system clock on a real-time data acquisition system provides useful information about the performance of the system. Hence this long discussion.
Data System Clock, NTP and GPS
The data system at the Manitou Forest Observatory (aka, the DSM) uses a GPS receiver and the NTP (Network Time Protocol) software to set the system clock, which, in addition to the normal uses of a system clock, is used to time-tag the data samples.
The serial messages from the GPS are received on serial port 3, /dev/ttyS3. The pulse-per-second square-wave signal (PPS) from the GPS is also connected to the DCD line of that serial port. A patch has been added to the Linux kernel on the data system so that an interrupt function can be registered to run in response to the DCD interrupts. This interrupt function will be called immediately after the rising edge of the PPS signal has been detected by the serial port hardware.
The NTP software on the DSM runs a reference clock driver for a Generic NMEA GPS Receiver, with PPS. This driver reads the 1 second GPS RMC records from the serial port, and registers a function to be run on receipt of the PPS interrupt. NTP then uses these two sets of information to create a GPS reference clock. NTP then monitors the state of the GPS reference clock and the system clock, and makes gradual adjustments to the system clock to bring it to close agreement with the GPS clock.
The RMC records contain the current date and time, in addition to latitude, longitude, and other quantities. The transmission time of the RMC message is not tightly controlled within the GPS and appears to be primarily effected by lags associated with internal GPS processing, and is also likely effected by what other NMEA messages are enabled for output on the GPS. The exact receipt time of the RMC message is not used for clock adjustments. NTP simply uses the time fields within the RMC message as an absolute time label for the previous PPS, whose timing is very precise.
Clock Variables
We monitor the following variables to keep track of the DSM timekeeping, and plot them on the daily web plots:
- GPSdiff: The time difference, in seconds, between the time-tag that was assigned to a RMC message and the date and time that is contained within the message. The time-tag assigned to a message sample is the value of the system clock at the moment the first byte of the message was received. For example, a value of 0.6 sec means that the data system assigned a time-tag to the RMC message that was 0.6 seconds later than the time value contained within the message. As discussed above, GPSdiff is not a precise measurement of clock differences and is not used to adjust the system clock. It gives a crude value of the agreement of the clocks and possible effects of I/O latency and buffering in the data system. When 5 minute statistics are computed, the maximum and minimum values of GPSdiff for each 5 minute period are written to the output NetCDF files as GPSdiff_max and GPSdiff_min.
- GPSnsat: number of satellites being tracked by the receiver, that is, the number of satellites whose signals are used in its time and location solution. GPSnsat in the NetCDF files and plots is a 5 minute mean.
NTP on the DSM is configured to log its status in a "loopstats" file. See http://www.eecis.udel.edu/~mills/ntp/html/monopt.html for information on the NTP monitoring options. The loopstats file includes these variables, which have been merged into the Manitou data archive:
- NTPClockOffset: the estimated offset of the GPS time from the data system time. A positive value indicates that NTP has determined that the GPS clock is ahead of the system clock, i.e. the GPS is showing a later time than the system clock. The maximum, minimum and mean values of NTPClockOffset in each 5 minute period are computed and written to the NetCDF files and plotted as NTPClockOffset_max, NTPClockOffset_min and NTPClockOffset.
- NTPFreqOffset: the correction applied to the system clock frequency in parts-per-million. A positive value indicates that NTP has determined that the system clock oscillator is slow and the NTPFreqOffset PPM values are being added periodically to the system clock counter. The NetCDF files and plots contain 5 minute means of NTPFreqOffset.
The NTP logs have not been recorded consistently since the beginning of the project. Year 2010 data from May 3 to August 12th and Oct 14th to November 9th are available, as well as all data from April 9, 2011 onward.
Replacement of Garmin GPS
On April 12, 2011 the old Garmin GPS 25-HVS at the tower was replaced with a newer Garmin 18x-LVC model. The model numbers are shown in the $PGRMT messages in the archive, where the time is UTC:
data_dump -i 1,30 -A manitou_20110412_120000.bz2 | fgrep PGRMT
...
2011 04 12 16:41:39.6568    0.15      49 $PGRMT,GPS 25-HVS VER 2.50 ,P,P,R,R,P,,23,R*08\r\n
2011 04 12 16:42:50.4248  0.1249      51 $PGRMT,GPS 18x-LVC software ver. 3.10,,,,,,,,*6D\r\
Unexpectedly, the newer GPS provided much better time-keeping.
The following plot is for the old 25-HVS model for 3 days prior to the swap:
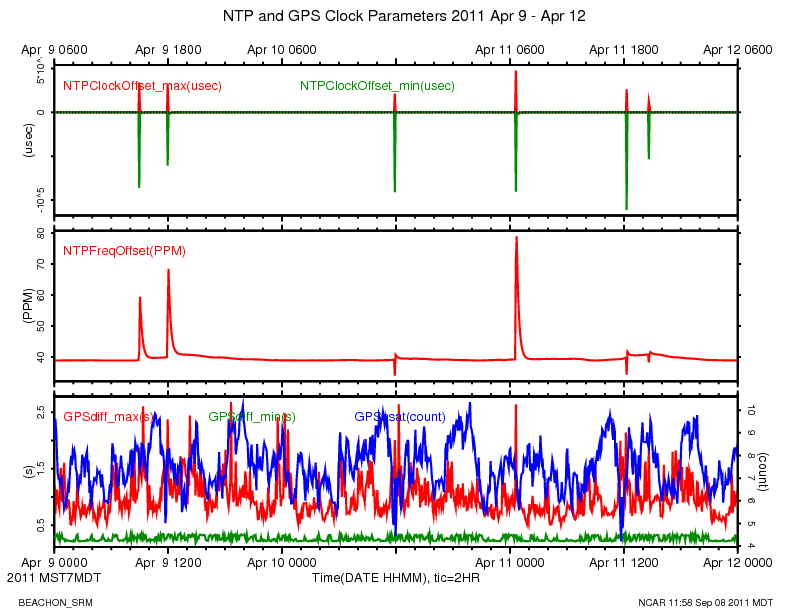
The NTPClockOffset shows spikes between -100000 to 50000 microseconds during this period, which is much worse than expected for a GPS/NTP reference clock. The spikes in NTPClockOffset are simultaneous with positive jumps in GPSdiff_max, up to as much as 2.5 seconds. These events seem to happen when the number of tracked satellites changes, which indicates that internal processing lags in the 25-HVS cause it to report late, causing large values of GPSdiff. The extent of this effect on the timing of the PPS signal is unknown.
The following plot shows a close up of one of the clock offset spikes using un-averaged data:
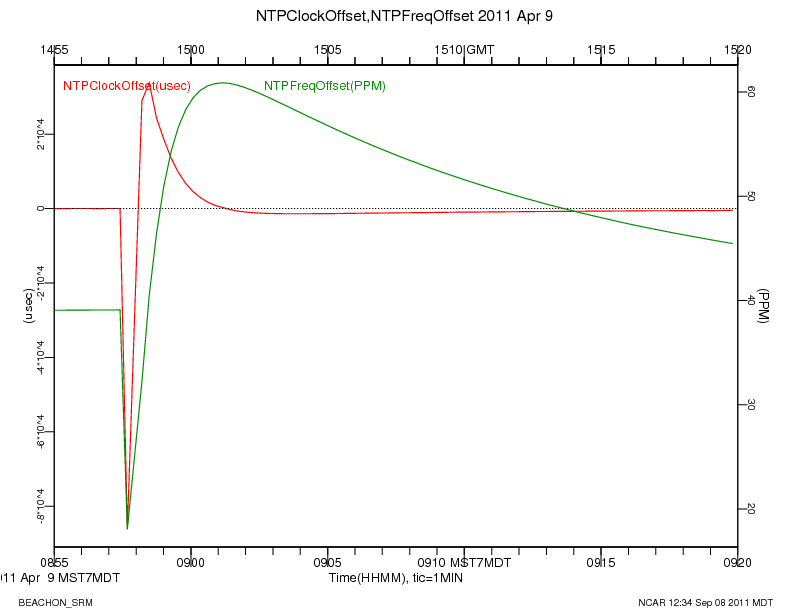
The sudden downward jump in NTPClockOffset causes NTP to think that the GPS clock is earlier than the system clock. NTP starts to correct for the offset by slowing down the system clock, as seen in the negative values for NTPFreqOffset. When the GPS recovers from its delayed reporting, NTP then sees positive values for NTPClockOffset and adjusts the system clock ahead.
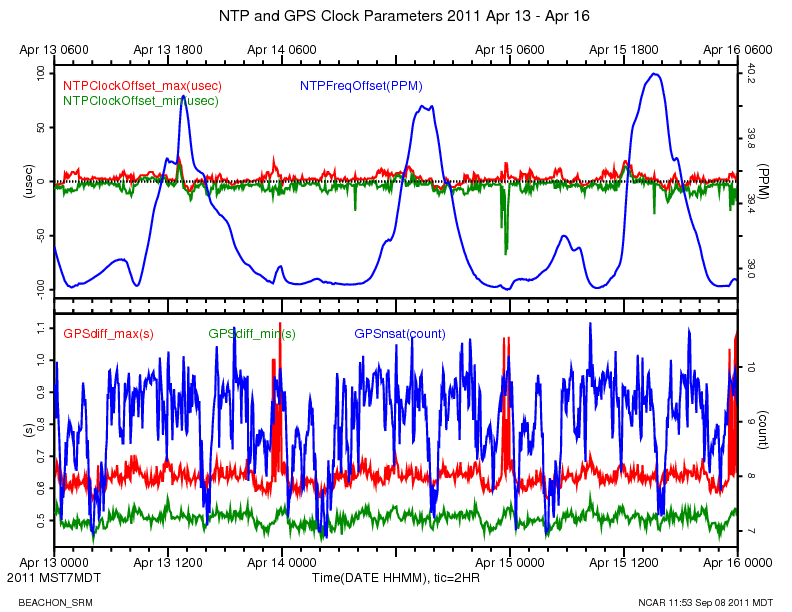
After installing 18x-LVC, the NTPClockOffset is in a much improved range, from -70 to 25 microseconds. NTPFreqOffset is also in a much tighter range, indicating that NTP is applying smaller corrections to the system clock. GPSdiff is also much better behaved, ranging from a minimum of 0.5 to 1.1 seconds. The number of satellites tracked by the new GPS is also generally higher.
Temperature Effects
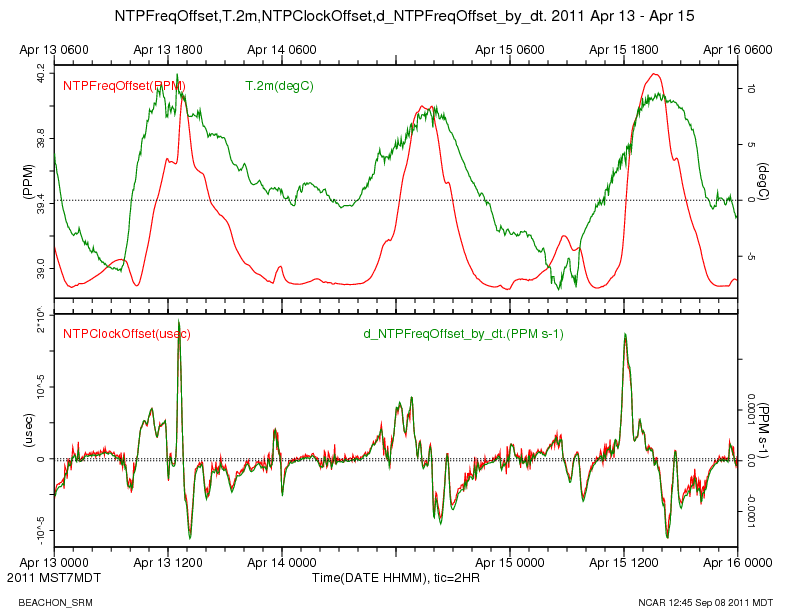
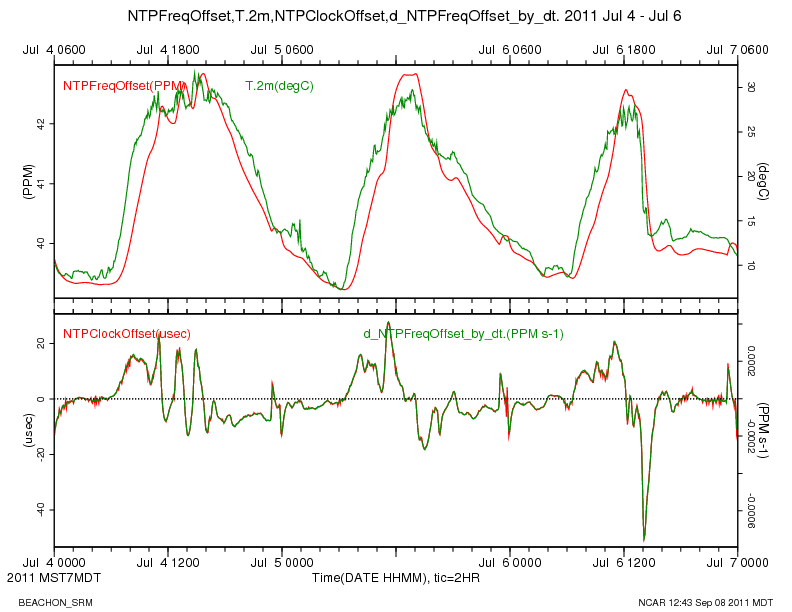
The frequency offset shows a temperature dependence in the system clock oscillator. We do not measure the temperature inside the data system enclosure, which is at the base of the tower. The nearest temperature measurement is of the ambient air at 2 meters up the tower. The top panel in the plot below shows a time series of the air temperature, along with NTPFreqOffset, for a cool 3 day period in April, after the installation of the new GPS. It appears that when the air temperature is below 5 deg C, the system clock oscillator does not show an obvious temperature relation.
The bottom panel shows a close relationship between the NTPClockOffset and the time derivative of NTPFreqOffset, which, I believe, indicates how NTP adjusts the system clock based on the measured offset. It also enforces the obvious conclusion that we could improve the time-keeping by insulating the CPU from temperature changes.
On a warmer 3 day period in July, where the temperatures were all above 5 degC, the temperature effect on the system clock oscillator is very evident.
Time Offsets During File Transfers
The periodic spikes in GPSdiff_max up to 1 second that occur at 23:00 local time and last about an hour, are simultaneous with the network transfer of the day's data files from the DSM to the RAL server. These suggest that increased sample buffering and latency is happening at these times, which needs to be investigated and improved.
A close-up of the file transfer on April 14, 23:00, plotted below, shows several events where NTPClockOffset first has a negative spike, indicating that NTP has determined that the GPS clock is behind the system clock and starts to slow down the system clock. These down spikes appear to be due to a delay in the response to a PPS interrupt. The interrupt latency appears to be short lived, because the NTPClockOffset becomes positive, and the system clock is re-adjusted. The April 14 transfer is shown in this plot:
![]()
In July, the clock behaviour during the file transfer is similar, but the initial increase in NTPClockOffset and a rising slope in NTPFreqOffset might be due to increased heating of the system clock oscillator, due to increased CPU load during the file transfers. Wild conjecture? After a quick scan of the web plots of 5 minute averages, I think these positive bumps in NTPFreqOffset seem to occur during file transfers when the outside air temperatures are above 0 C, and don't occur in colder conditions.
![]()
ppstest and ntpq
On the DSM, the ppstest program is helpful for gaining an understanding of the system and GPS clocks. It displays the system clock value when the interrupt function is called at the time of the assertion and the clear of the PPS signal. Do ctrl-C to terminate ppstest.
root@manitou root# ppstest /dev/ttyS3
trying PPS source "/dev/ttyS3"
found PPS source #3 "serial3" on "/dev/ttyS3"
ok, found 1 source(s), now start fetching data...
source 0 - assert 1315494544.999995675, sequence: 37249847 - clear  1315494544.099998000, sequence: 37249862
source 0 - assert 1315494544.999995675, sequence: 37249847 - clear  1315494545.099995000, sequence: 37249863
source 0 - assert 1315494545.999994675, sequence: 37249848 - clear  1315494545.099995000, sequence: 37249863
source 0 - assert 1315494545.999994675, sequence: 37249848 - clear  1315494546.099993000, sequence: 37249864
source 0 - assert 1315494546.999994675, sequence: 37249849 - clear  1315494546.099993000, sequence: 37249864
ctrl-C
The above sequence shows that the system clock is behind the GPS. The system time when the interrupt function is being called on the PPS assert is 5 microseconds before the exact second (0.999995). This corresponds to a NTPClockOffset of a positive 5 microseconds. This is confirmed with the ntpq program (which reports its offset in milliseconds):
root@manitou root# ntpq -p
     remote           refid      st t when poll reach   delay   offset  jitter
==============================================================================
xral             38.229.71.1      3 u   34   64  377    0.320    3.804   0.031
 LOCAL(0)        .LOCL.          10 l  93d   64    0    0.000    0.000   0.000
oGPS_NMEA(0)     .GPS.            2 l    6   16  377    0.000    0.005   0.031
The ntpq output indicates (with the leading 'o') that NTP is using the GPS as the system's reference clock. It also displays the offset of the RAL server's clock of 3.804 milliseconds, and indicates with an 'x' that it is not using that clock as a reference. The RAL server uses NTP over a WIFI connection to adjust its clock, so it is not as accurate as the DSM.
The loopstats file also shows the 5 usec offset at this time:
55812 54504.454 0.000005000 39.301 0.000030518 0.001408 4
55812 54520.455 0.000006000 39.302 0.000030518 0.001415 4
55812 54536.454 0.000005000 39.303 0.000030518 0.001392 4
55812 54552.454 0.000005000 39.305 0.000030518 0.001372 4
I do not believe I've seen a jitter value less than 31 microseconds. Not sure why that is. I believe the jitter is the standard deviation of the offset, but the NTP documentation is rather unclear to me.
The 5 minute statistics of data from the turbulence tower, for the entire dataset, Jul 8 2009 to the present have been recomputed, and written to the NetCDF files. The new values incorporate the following changes:
- In each 20 Hz sample from a CSAT3 sonic, if any of the CSAT diagnostic bits are non-zero, then the values for that sample (u,v,w,tc) are marked as missing, and not added to the 5 minute statistics. This should result in better 5 minute statistics by excluding data when the transducer signals are poor, such as during rain.
- The calculation of the CSAT3 sonic diag value has changed. Previously the high-rate value could vary from 0 to 31, depending on which diagnostic bit was set. Now the high-rate diag value is just a 0 (no bits set) or 1 (one more more bits set), and the average is now the fraction of time in the 5 minute period that one or more diagnostic bits were set.
- The LICOR 7500's have a inherent sampling lag of 0.186 seconds, as documented in the manual from Licor. Our previous processing did not account for that lag when computing covariances between the sonic winds and the h2o and co2 from the Licor. This could result in increased values for the computed fluxes of water vapor and CO2.
- Units of CO2 have been changed from mmol/m^3 to g/m^3, the same as for H2O from the 7500s.
Aug 15, 11:10 MDT
Logged into the DSM and checked that the Licor 7500 delay parameter was set to 0 on all units. Shut down the data process, and used minicom. Do "(Outputs ?)" to query the, and "(Outputs (BW 10))" to resume the licor output.
Conclusion: all Delay values were set to 0, as they should be.
adn
minicom ttyS2
ctrl-A w   (enable line wrap)
ctrl-A e   (enable echo)
ctrl-A f   (send break)
(Outputs ?)
(Outputs (BW 10))
ctrl-A q   (quit minicom)
aup
ttyS2, 2m:
Outputs (BW 10)(Delay 0)(SDM (Address 7))(Dac1 (Source NONE)(Zero 0)(Full 5))(Dac2 (Source NONE)(Zero 0)(Full 5))(RS232 (Baud 9600)(Freq 1e
1)(Pres TRUE)(Temp TRUE)(Aux FALSE)(Cooler FALSE)(CO2Raw TRUE)(CO2D TRUE)(H2ORaw TRUE)(H2OD TRUE)(Ndx FALSE)(DiagVal TRUE)(DiagRec FALSE)(L
abels FALSE)(EOL "0A")))
ttyS11, 16m:
(Outputs (BW 10)(Delay 0)(SDM (Address 7))(Dac1 (Source NONE)(Zero 0)(Full 5))(Dac2 (Source NONE)(Zero 0)(Full 5))(RS232 (Baud 9600)(Freq 1
e1)(Pres TRUE)(Temp TRUE)(Aux FALSE)(Cooler FALSE)(CO2Raw TRUE)(CO2D TRUE)(H2ORaw TRUE)(H2OD TRUE)(Ndx FALSE)(DiagVal TRUE)(DiagRec FALSE)(
Labels FALSE)(EOL "0A")))
ttyS17, 43m:
(Outputs (BW 10)(Delay 0)(SDM (Address 7))(Dac1 (Source NONE)(Zero 0)(Full 5))(Dac2 (Source NONE)(Zero 0)(Full 5))(RS232 (Baud 9600)(Freq 1
e1)(Pres TRUE)(Temp TRUE)(Aux FALSE)(Cooler FALSE)(CO2Raw TRUE)(CO2D TRUE)(H2ORaw TRUE)(H2OD TRUE)(Ndx FALSE)(DiagVal TRUE)(DiagRec FALSE)(
Labels FALSE)(EOL "0A")))
Arrived: 10:12am MDT
Departed: 1:45pm MDT
Ned and I did a couple of chores on this visit. First, we fixed the 43M sonic. It seemed to be the port on the Emerald Card. Switched 43M sonic from port16 to port20. Ned updated the xml. Second, we replaced two 15M cable from 43M Licor with a 30M cable. When we did this we noticed interrupts on the dsm. Having unplugged the battery charger for the laptop to talk with dsm, we plugged the charger back in and the dsm didn't give as much interrupts. [shrugging] Will keep an eye on this odd situation. Third, we clean all three Licors. Fourth, took guywire tensions.
Want to mention that there is a 2M tower just 15' South of the Turbulence Tower. WTF?
Also, there are no more ports on ethernet switch or 120AC power.
Ned noticed a drop out of data from 43 meters on Jul 10.
http://www.eol.ucar.edu/isf/projects/BEACHON_SRM/isfs/qcdata/plots/20110711/plots_all.shtml
I logged into the manitou data system on Jul 13, and tried to resurrect it.
I tried rserial, minicom and powering the sonic off and on:
eio 16 0
eio 16 1
rs 16
Got nutt'in
The licor is working. We compute its mean and higher moments in
combination with the sonic data, so that if we don't have sonic
data then we see no co2, co2'co2', w'co2', etc.
We do see the status values from the licor, and I rserial'd to
it and see that it's working.
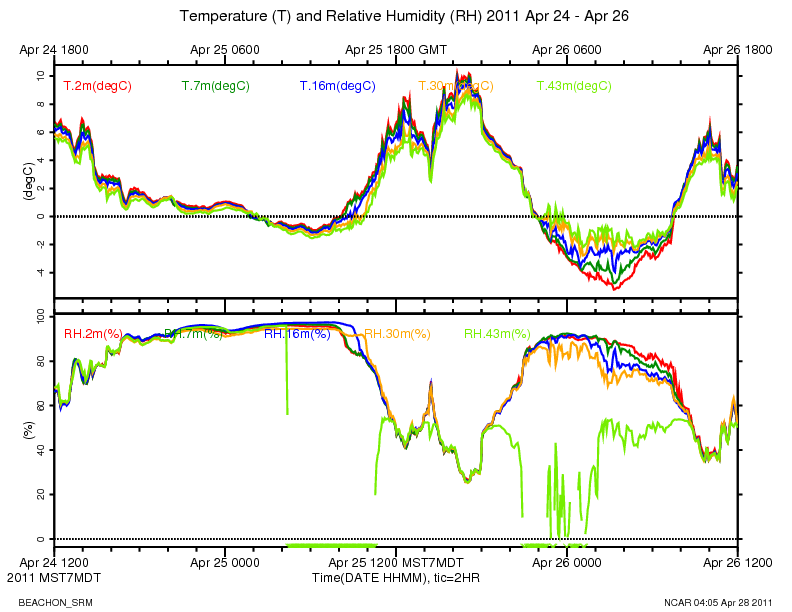
RH at 43m has been bad for a while. Looking back through the plots, looks like it failed the night of Apr 25 during a period of near 100% RH.
http://www.eol.ucar.edu/isf/projects/BEACHON_SRM/isfs/qcdata/plots/20110425/trh_20110425.png
The plot of GPSdiff_max for May 22, 2011 shows a maximum value of around 25 seconds between 11:05 and 17:00 UTC, indicating something went haywire with the data collection during those times.
Looking at the downloaded data, it appears that data stopped coming in on the Diamond serial ports at 11:05, and resumed at 17:00. There is not a large gap in data from the 3 sensors that are sampled on the Viper serial ports, but they show large time tag delta-Ts, followed by many small delta-Ts, symptomatic of the system getting behind and having to do major buffering. Perhaps a "storm" of interrupts from the Diamond that finally cleared up? Moisture somewhere?
I don't have time to look into it at this time, but here are some dumps of data around the problem.
data_stats /scr/isfs/projects/BEACHON_SRM/raw_data/manitou_20110522_000000.dat
2011-05-24,16:56:30|INFO|opening: /scr/isfs/projects/BEACHON_SRM/raw_data/manitou_20110522_000000.dat
EOFException: /scr/isfs/projects/BEACHON_SRM/raw_data/manitou_20110522_000000.dat: open: EOF
sensor  dsm sampid    nsamps |------- start -------|  |------ end -----|    rate minMaxDT(sec) minMaxLen
          1     20     39901 2011 05 22 00:00:00.998  05 22 11:05:01.461    1.00  0.336  1.643   19   19
          1     30     84632 2011 05 22 00:00:00.571  05 22 11:59:59.719    1.96  0.042 26.076   51   73
          1    100    843525 2011 05 22 00:00:00.160  05 22 11:59:59.944   19.53 -2.052 27.951   12   16
          1    110    415176 2011 05 22 00:00:00.113  05 22 11:59:59.959    9.61 -2.016 28.058   39   87
          1    120     41042 2011 05 22 00:00:00.185  05 22 11:05:01.388    1.03  0.294  1.643   29   31
          1    200    798028 2011 05 22 00:00:00.166  05 22 11:05:01.873   20.00  0.005  0.596   12   12
          1    220     40687 2011 05 22 00:00:00.791  05 22 11:05:01.158    1.02  0.357  1.604   28   29
          1    300    798048 2011 05 22 00:00:00.168  05 22 11:05:01.884   20.00  0.002  0.585   12   12
          1    310    399023 2011 05 22 00:00:00.000  05 22 11:05:01.841   10.00  0.042  0.454   44   49
          1    320     40488 2011 05 22 00:00:00.233  05 22 11:05:01.428    1.01  0.356  1.613   28   29
          1    330      7981 2011 05 21 23:59:55.213  05 22 11:04:55.250    0.20  4.415  5.586   49   60
          1    400    798041 2011 05 22 00:00:00.005  05 22 11:05:01.883   20.00  0.001  0.591   12   12
          1    420     40772 2011 05 22 00:00:00.328  05 22 11:05:01.192    1.02  0.344  1.614   29   30
          1    500    798042 2011 05 22 00:00:00.171  05 22 11:05:01.913   20.00  0.002  0.603   12   12
          1    510    399020 2011 05 22 00:00:00.007  05 22 11:05:01.814   10.00  0.037  0.436   44   49
          1    520     40747 2011 05 22 00:00:00.342  05 22 11:05:01.149    1.02  0.372  1.588   27   29
[maclean@porter ~]$ data_stats /scr/isfs/projects/BEACHON_SRM/raw_data/manitou_20110522_120000.dat
2011-05-24,16:57:04|INFO|opening: /scr/isfs/projects/BEACHON_SRM/raw_data/manitou_20110522_120000.dat
EOFException: /scr/isfs/projects/BEACHON_SRM/raw_data/manitou_20110522_120000.dat: open: EOF
sensor  dsm sampid    nsamps |------- start -------|  |------ end -----|    rate    minMaxDT(sec) minMaxLen
          1     20     25156 2011 05 22 17:00:47.215  05 22 23:59:59.960    1.00  0.019     1.371   19   29
          1     30     73288 2011 05 22 12:00:25.745  05 22 23:59:59.741    1.70  0.104    26.116   51   73
          1    100    750227 2011 05 22 12:00:28.065  05 22 23:59:59.959   17.38 -2.052    27.951   12   16
          1    110    337790 2011 05 22 12:00:28.120  05 22 23:59:59.922    7.82 -2.016    28.058   17   69
          1    120     25895 2011 05 22 17:00:47.289  05 22 23:59:59.553    1.03  0.029     1.756   29   38
          1    200    502634 2011 05 22 17:01:05.737  05 22 23:59:59.999   20.00  0.000     2.518    2  466
          1    220     25715 2011 05 22 17:00:47.290  05 22 23:59:59.392    1.02  0.028     1.594   28   39
          1    300    502351 2011 05 22 17:01:20.419  05 22 23:59:59.968   20.00  0.000     2.538    2  465
          1    310    251531 2011 05 22 17:00:47.284  05 22 23:59:59.926   10.00  0.050     0.154   44   66
          1    320     25590 2011 05 22 17:00:47.291  05 22 23:59:59.734    1.02  0.028     1.315   28   39
          1    330      5032 2011 05 22 11:05:00.251  05 22 23:59:50.264    0.11  0.061 21347.049    6   61
          1    400    502055 2011 05 22 17:01:35.059  05 22 23:59:59.987   20.00  0.001     2.508    3  466
          1    420     25769 2011 05 22 17:00:47.292  05 22 23:59:59.864    1.02  0.029     1.523   29   37
          1    500    502936 2011 05 22 17:00:45.341  05 22 23:59:59.998   19.99  0.003     4.123   12  466
          1    510    251530 2011 05 22 11:05:01.916  05 22 23:59:59.963    5.41  0.027 21345.401   43   50
          1    520     25730 2011 05 22 17:00:47.294  05 22 23:59:59.423    1.02  0.028     1.631   26   39
Data kept coming in on the Viper serial ports (ids=30,100,110, GPS, sonic and licor at 2m), but had time tag issues, apparently because buffers filled up. Here's a snippet of the 2m sonic data in hex, showing a 28 second time tag jump, but no skip in the sonic sequence (byte 9: f8,f9,fa,fb,fc, etc)
2011 05 22 11:05:53.8243 0.05004      12 20 06 0b 03 39 ff 6e e8 f5 0f 55 aa
2011 05 22 11:05:53.8743 0.04997      12 6a 06 0f 03 1b ff 6a e8 f6 0f 55 aa
2011 05 22 11:05:53.9243 0.05002      12 bf 05 b1 02 de fe 69 e8 f7 0f 55 aa
2011 05 22 11:05:53.9743 0.04998      12 4d 05 cb 02 d0 fe 6e e8 f8 0f 55 aa
2011 05 22 11:06:21.9147   27.94      12 35 05 d6 02 df fe 71 e8 f9 0f 55 aa
2011 05 22 11:06:21.9272  0.0125      12 03 06 7f 03 30 ff 6f e8 fa 0f 55 aa
2011 05 22 11:06:21.9397  0.0125      12 32 06 7f 03 98 ff 65 e8 fb 0f 55 aa
2011 05 22 11:06:21.9522  0.0125      12 46 05 59 02 35 ff 6d e8 fc 0f 55 aa
2011 05 22 11:06:21.9647  0.0125      12 83 05 1a 03 c3 fe 75 e8 fd 0f 55 aa
After the gap, the 0.0125 dTs result from unpacking multiple samples from a buffer, where the code computes a dT = 10 bits/byte / (9600 bits/sec) * 12 bytes/sample = 0.0125 sec/sample
I see no indication of a problem in the system logs, or any weird clock adjustments in the NTP loopstats,peerstats.
Arrived: 10:30am MDT
Departed: 11:20am MDT
Kurt and I installed three LiCors on turbulence tower at heights of 2M, 15M and 45M. TRHs were installed on all levels. New GPS was added and old Garmin was removed.
LiCor heights:
2M-1166
15M-1163
45M-1164
Apr 12, 11:32 am
The output format and reporting rate of the 3 Licor 7500s that were re-installed today had been reset during the calibration procedure to generate verbose output, with labels. To save archive space, we configure the units for a terse output, without labels, at 10 Hz.
To setup the Licors for the format that our data system expects, do the following from the data system login prompt:
- shut down the data process
adn - run minicom on the Licor port (ttyS2=2m, ttyS7=7m, ttyS11=16m, ttyS14=30m, ttyS17=43m)
minicom ttyS2 - If the baud rate agrees with minicom (9600) you should see the default Licor output
- Send a break character, by doing "control-A f" from minicom
ctrl-Af - Send these strings to the Licor:
(Outputs (RS232 (EOL "0A") (Labels FALSE) (DiagRec FALSE) (Ndx FALSE) (Aux FALSE) (Cooler FALSE)
(CO2Raw TRUE) (CO2D TRUE) (H2ORaw TRUE) (H2OD TRUE) (Temp  TRUE) (Pres TRUE) (DiagVal TRUE)))
(Outputs (BW 10) (Delay 0) (RS232 (Freq 10.0)  (Baud 9600)))
(Outputs (Dac1 (Source NONE)(Zero 0)(Full 5)) (Dac2 (Source NONE)(Zero 0)(Full 5)))
- You won't see much output, perhaps just 1 column of digits on the right-hand-side, since the Licor is sending just a line-feed termination and no carriage-return. You can turn on line wrap in minicom, with "control-A w" to see the data stream wrap from side to side:
ctrl-Aw - Exit minicom with control-A q
ctrl-Aq - restart the data process:
aup - check the Licor data with rserial. It may take 30 seconds or so for the data system to open the port. During that time rserial will report an error about not finding the sensor. Eventually it should work.
rs 2 - The data should look like:
248\t0.06460\t12.4193\t0.01218\t81.586\t16.10\t76.1\t\n
248\t0.06462\t12.4179\t0.01207\t81.459\t16.11\t76.1\t\n
- Exit rserial with control-D
ctrl-d
Calibration process for LiCors 7500s. I calibrated all five LiCors. Calibration included post cal, desiccant change, spot check, zero/span. I used N2 tank which went through a scrubber of Ascarite II and Drierite to give the zero for both CO2 and H20.
Post-Cal conditions were checking zeros, span and dew point. Spans included for CO2 were a bottle of 394.611ppm and 378.867ppm. For H2O I used the Thunder Scientific, humidity chamber, set at 25C at 80%RH. Dew point was equal to 21.31C.
Zero Post-Conditions: Pressure 85.04kPa, Temp=27.3C
Sensor ID |
CO2(umol/mol) |
H2O(mmol/mol) |
CO2 Coeff.(zero/span) |
H2O Coeff.(zero/span) |
|---|---|---|---|---|
0813 |
0.08 |
1.11 |
N/A |
N/A |
1166 |
6.58 |
-1.59 |
0.8896/1.0051 |
0.8583/0.9969 |
1163 |
-7.90 |
0.24 |
0.8709/1.0082 |
0.8510/1.0229 |
1167 |
-3.23 |
-0.15 |
0.8770/1.0207 |
0.8732/0.9986 |
1164 |
-10.80 |
0.43 |
0.8902/1.0233 |
0.8635/1.0008 |
Span Post-Conditions: Column2 is standard 394.611ppm; Column3 is standard 378.867ppm; Column4 is dew point standard 21.31C
Sensor ID |
CO2(ppm) |
CO2(ppm) |
H20(C) |
|
|---|---|---|---|---|
0813 |
----------------------- |
-------------------------- |
-------------------- |
|
1166 |
400.83 |
387.48 |
21.16C |
|
1163 |
389.02 |
373.09 |
22.07 |
|
1167 |
398.17 |
382.72 |
20.93 |
|
1164 |
389.60 |
373.81 |
21.82 |
|
Quick Check after desiccant was changed and ran for overnight. Pressure 82.62kPa, Temp 24.33C
Sensor ID |
CO2(ppm) |
H2O(C) |
CO2(378.867ppm) |
|---|---|---|---|
0813 |
--------------- |
-------------- |
-------------------------- |
1166 |
6.61 |
------------- |
------------------------- |
1163 |
-6.05 |
0.41 |
-------------------------- |
1167 |
-2.35 |
------------- |
--------------------------- |
1164 |
-6.61 |
0.43 |
380.54 |
Zero Calibration: CO2 and H20 were set to zero value.
Sensor ID |
CO2(ppm) |
H20(ppm) |
CO2 Coeff. |
H20 Coeff. |
|---|---|---|---|---|
0813 |
-0.01 |
0.00 |
0.9752 |
0.7374 |
1166 |
-0.03 |
0.00 |
0.8909 |
0.8605 |
1163 |
-0.01 |
0.00 |
0.8698 |
0.8532 |
1167 |
0.01 |
0.00 |
0.8766 |
0.8749 |
1164 |
0.01 |
0.00 |
0.8889 |
0.8662 |
Span Calibration: CO2 was spanned to 394.611ppm; H20 was spanned to dew point 21.31C.
Sensor ID |
CO2(ppm) |
H20(ppm) |
CO2 Coeff. |
H2O Coeff. |
|---|---|---|---|---|
0813 |
394.43 |
21.43 |
0.9936 |
1.0380 |
1166 |
394.43 |
21.44 |
1.0052 |
1.0497 |
1163 |
394.65 |
21.45 |
0.9950 |
1.0211 |
1167 |
394.84 |
21.41 |
1.0049 |
1.0258 |
1164 |
394.56 |
21.42 |
1.0008 |
1.0206 |
The TRH sensors went through a post cal check before re-calibration.
Here are the results.
Temperature: Tested over the range of -30 to 30. It has been almost 1 year since these sensors were calibrated 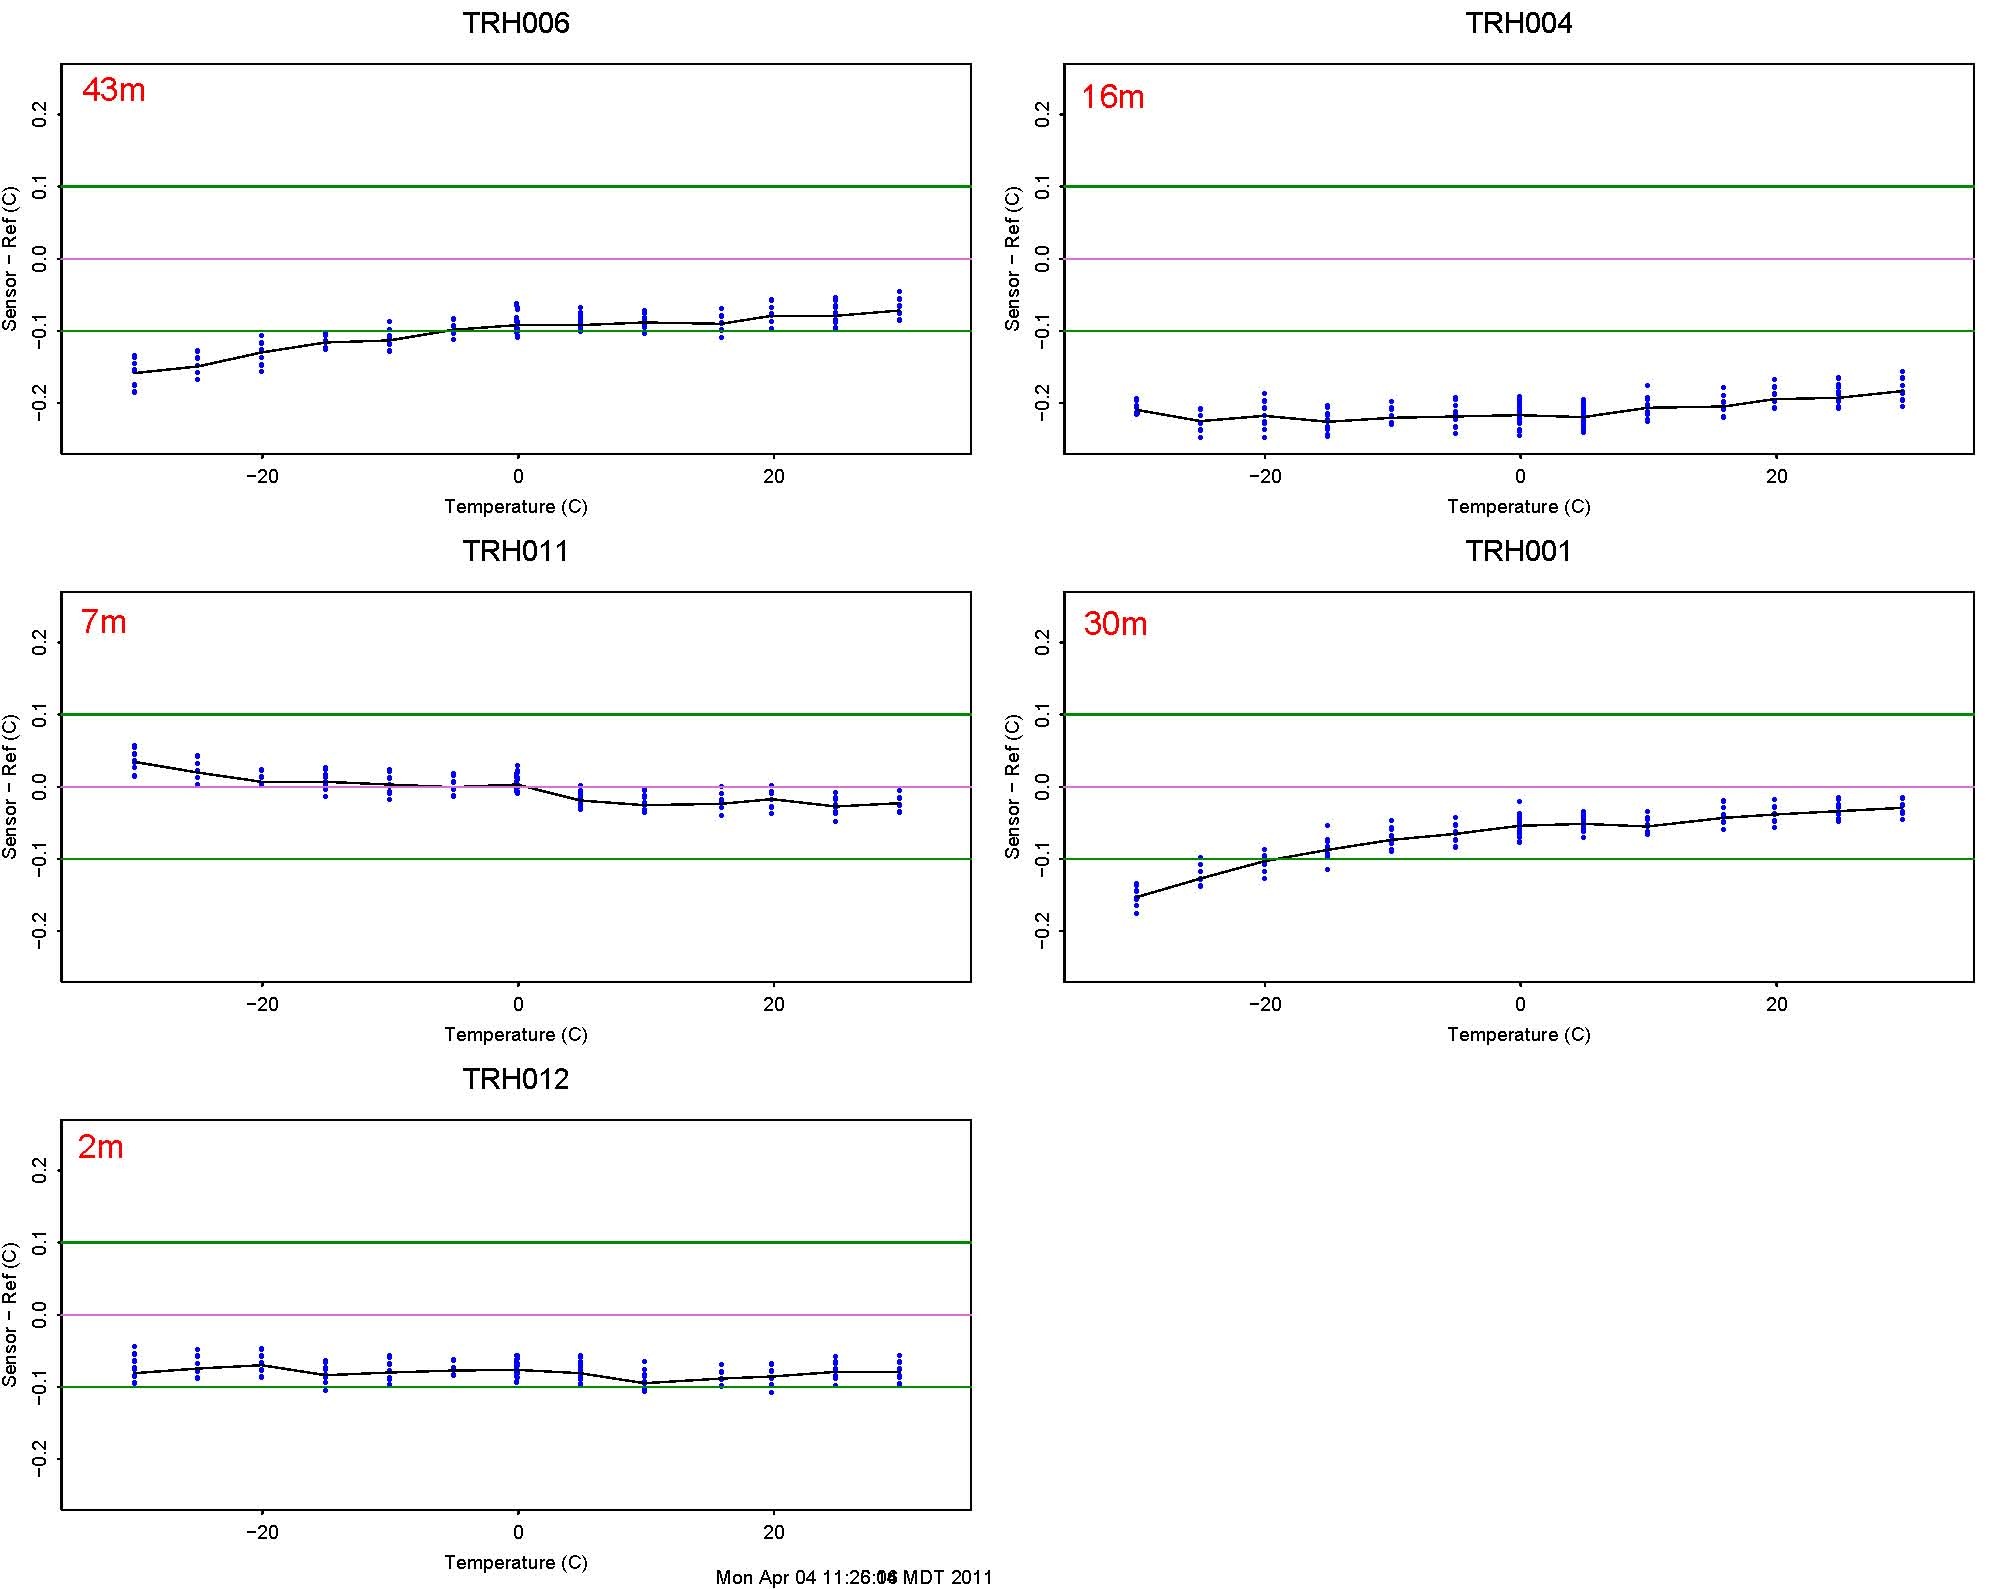
Relative Humidity: Tested over 10% to 90% at temperatures 25, 10, -3 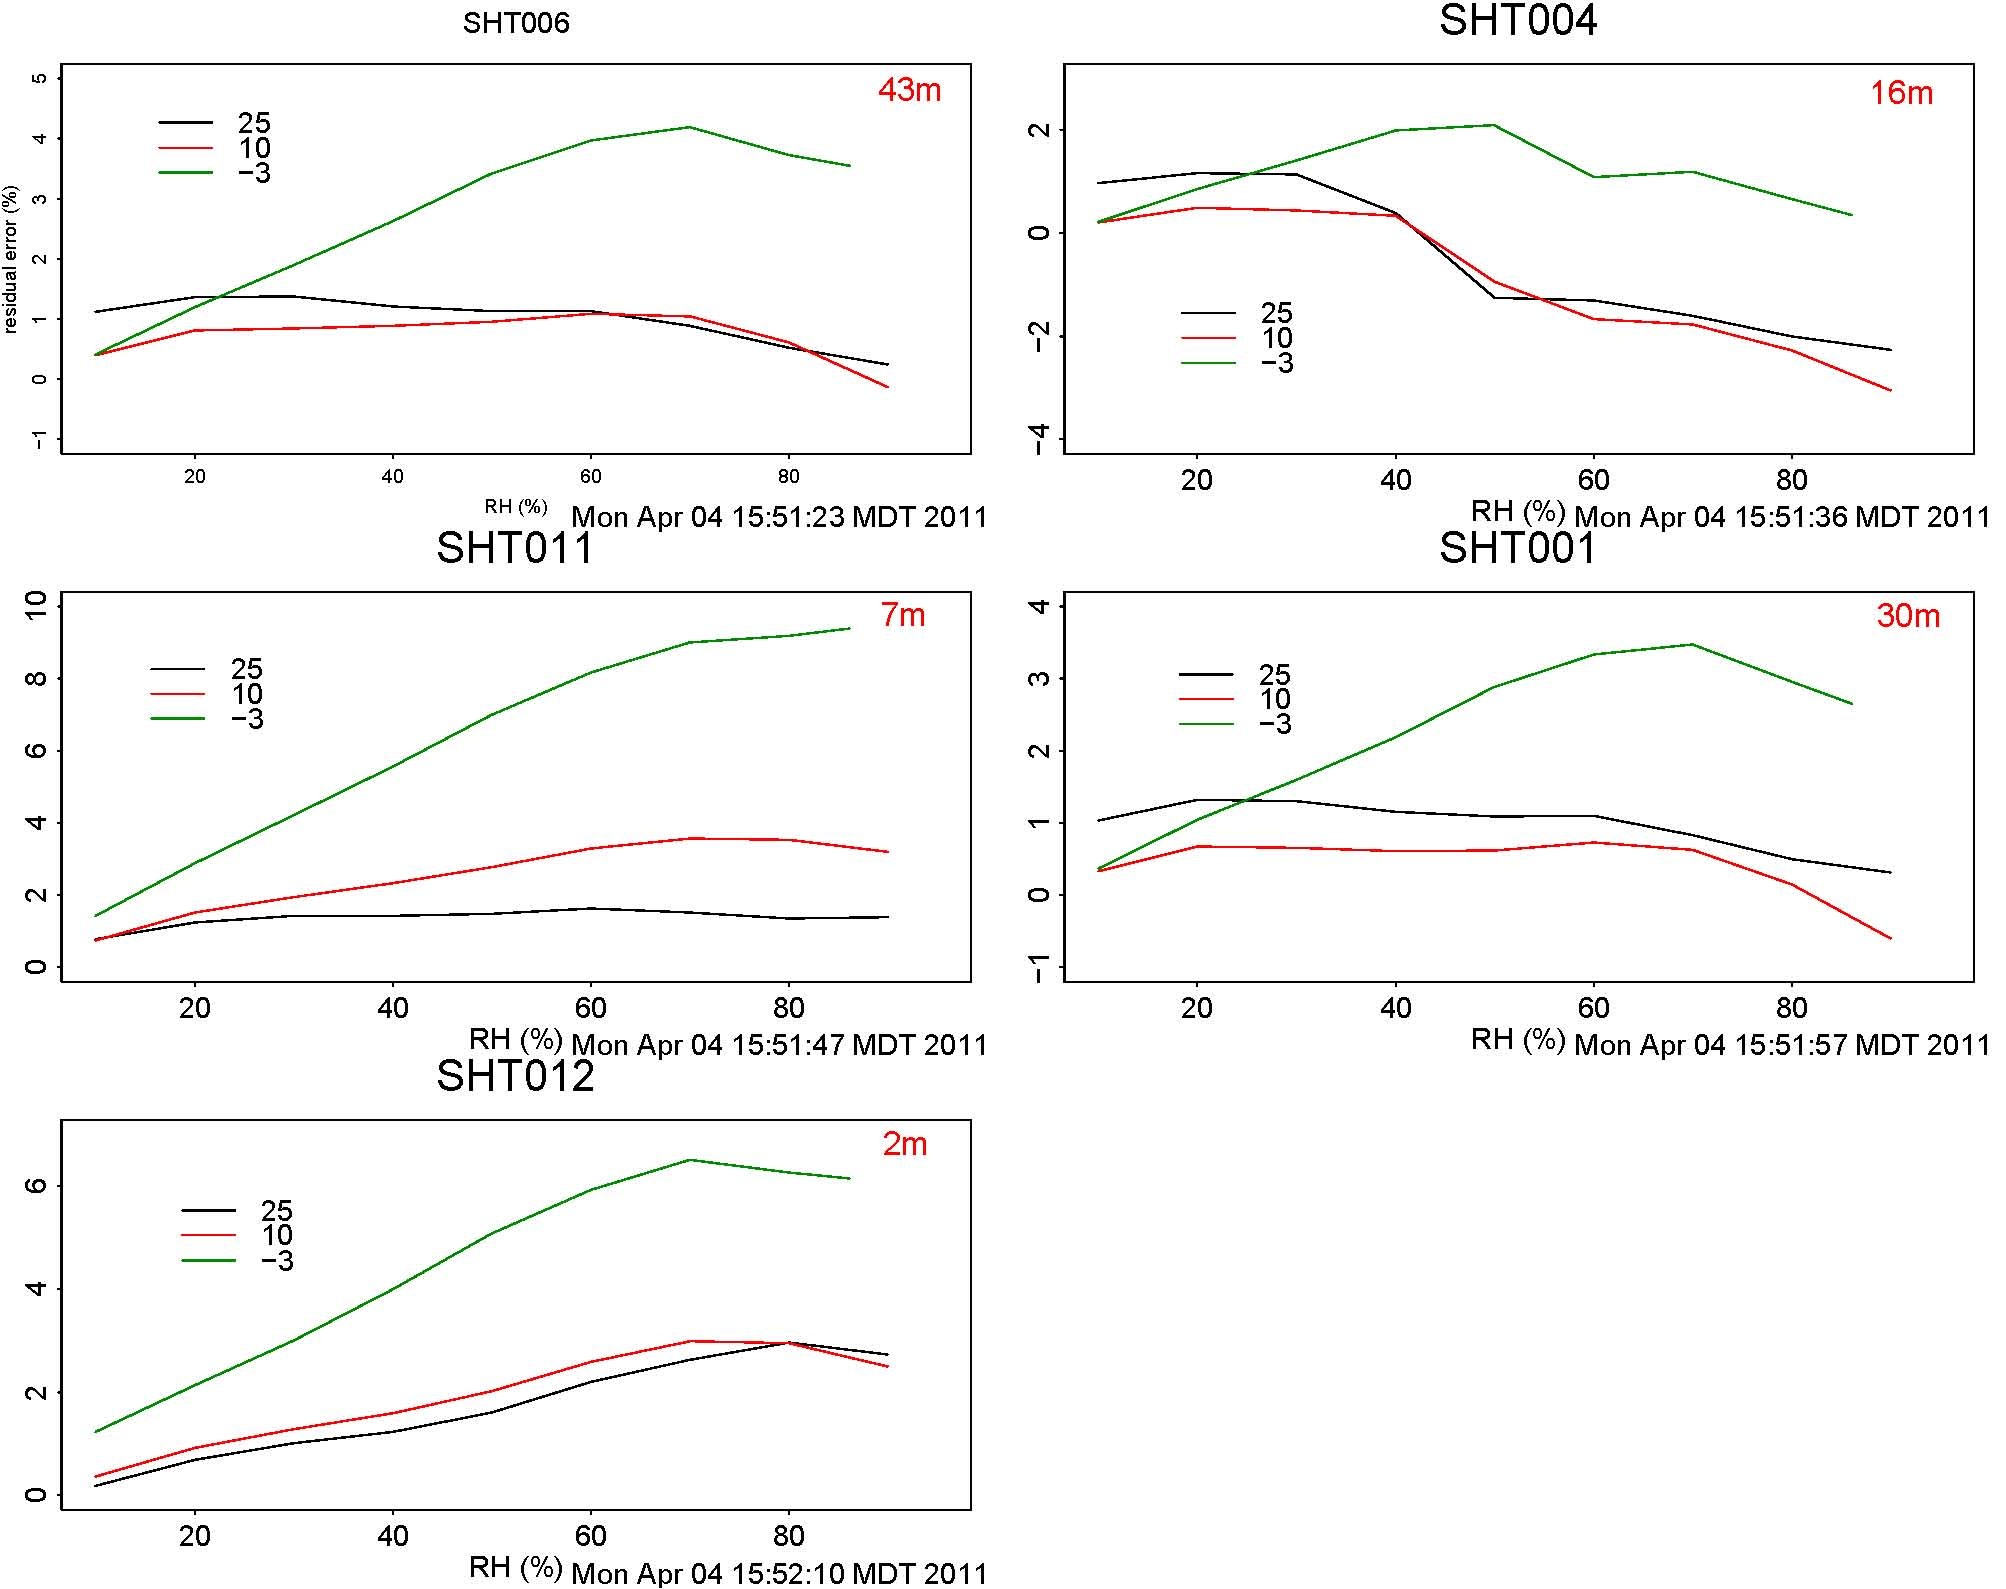
The Licor 7500 and TRH sensors were removed on 3/29. They will be re-calibrated and re-installed in about 2 weeks.
So sorry. This is a redundant log entry. First entry was in the main Manitou Log entry page.
Attendees: Chris, Kurt and Ned.
Arrived at 11:25am
Departed at 1:15pm
Removed LiCors and TRHs at all heights. The LiCors were at the following heights.
2m: s/n 1163
7m: s/n 1166
15m: s/n 1167
45m: s/n 1164
We unplugged main power to all LiCors in the battery boxes. Replaced both outside GFI outlets. Both outlets were blown. Power back to both outlets. Beacon back on.
Installed the latest version of nidas (revision 5771M) today, with the new process running at 19:49 UTC.
The new nidas has some improvements in the serial handling efficiency. Don't see any effect on the number of "spurious interrupts" though.
Also restarted ntp daemon. Added a "server ral" entry in /etc/ntp.conf so that we can compare our local GPS time source with the ral server.
ntpq -p shows good agreement (-8.285 millisecond offset) with the ral server:
ntpq -p
     remote           refid      st t when poll reach   delay   offset  jitter
==============================================================================
xral             208.75.88.4      3 u    7   64  377    0.368   -8.285   1.249
oGPS_NMEA(0)     .GPS.            2 l   15   16  377    0.000   -0.028   0.031
Querying the ral ntp server, with ntpq -p ral shows that it has offsets with its servers, probably related to the big delays over its wifi connection:
ntpq -p ral
     remote           refid      st t when poll reach   delay   offset  jitter
==============================================================================
+64.6.144.6      128.252.19.1     2 u  300 1024  177   43.800  -32.309  12.143
*208.75.88.4     192.12.19.20     2 u  997 1024  377   56.151   16.212   0.321
+64.73.32.134    192.5.41.41      2 u  502 1024  377   42.897    7.307 110.558
Later, Oct 16, 15:24 MDT, saw smaller offsets all around:
root@manitou root# ntpq -p
     remote           refid      st t when poll reach   delay   offset  jitter
==============================================================================
xral             208.75.88.4      3 u   39   64  377    0.354    1.108   0.390
oGPS_NMEA(0)     .GPS.            2 l    -   16  377    0.000    0.003   0.031
root@manitou root# ntpq -p ral
     remote           refid      st t when poll reach   delay   offset  jitter
==============================================================================
+64.6.144.6      128.252.19.1     2 u  135 1024  373   41.912    0.464  74.268
*208.75.88.4     192.12.19.20     2 u  840 1024  357   56.112    2.963   1.735
+64.73.32.134    192.36.143.150   2 u  317 1024  377   39.507    1.365  64.459
Data from the 7m TRH has been intermittent for more than a month.
Here's a typical dropout, where the unit quits reporting, then 15
hours later comes alive, with startup messages:
2010 10 02 14:07:54.4656       0      40 \x00\x00\r Sensor ID16    data rate: 1 (secs)\n
2010 10 03 05:28:49.2103 5.525e+04      29 \rcalibration coefficients:\r\n
2010 10 03 05:28:49.2517 0.04144      21 Ta0 = -4.042937E+1\r\n
2010 10 03 05:28:49.2827 0.03095      21 Ta1 =  1.022852E-2\r\n
2010 10 03 05:28:49.3134  0.0307      21 Ta2 = -2.096747E-8\r\n
2010 10 03 05:28:49.3445  0.0311      21 Ha0 = -1.479133E+0\r\n
2010 10 03 05:28:49.3773 0.03286      21 Ha1 =  3.554063E-2\r\n
2010 10 03 05:28:49.4057 0.02836      21 Ha2 = -1.382833E-6\r\n
2010 10 03 05:28:49.4390 0.03329      21 Ha3 =  3.354407E-2\r\n
2010 10 03 05:28:49.4693 0.03031      21 Ha4 =  3.666422E-5\r\n
2010 10 03 05:28:49.8050  0.3357      29 TRH16 4.91 94.96 4474 3057\r\n
Email from Ned:
the TRH at 7m now seems to be re-appearing during the night time and then at about 8am it drops out again...
http://www.eol.ucar.edu/isf/projects/BEACHON_SRM/isfs/qcdata/plots/20101001/Tprof_20101001.png
My guess is that it is a power problem, either in the cable, or corrosion in the unit. This unit and
cable was replaced on 7/22. The problem before was different, looking like a RS232 problem, where
I don't think we saw the bootup messages we're seeing now. https://wiki.ucar.edu/x/vBWdAw
7/22/10
re-tensioned all guy wires using transits to plumb tower.
replaced 7m and 15m trh cables, as well as 7m trh sensor
The Licor 7500 at 2m has not been reporting for a while.
Looking at /proc/tty/driver/serial for port 2 indicates that no characters have been received since the last reboot. As of Jul 18 the system uptime is 19 days.
Did "rs 2" to talk to the port. After sending carriage a return the 7500 responds with
^M(Error (Received TRUE))\n
So, it is alive and responding, just not sending data. Sent it a configuration command, setting the BW and RS232 parameters, which got it going again:
(Outputs (BW 10) (RS232 (Freq 10.0) (Baud 9600)))
It responded with the following and then started streaming data:
(Ack (Received TRUE)(Val 0))
Looks like it didn't come up in continuous reporting mode for some reason - either after a power outage, or after receiving some glitch characters on its input.
There may be a better command to get it going again once it has been interrupted.
I just knew from prior experience that the above works. Probably just a "(Outputs)" or
"(Outputs (BW 10))" would also work.
The turbulence tower data system clock was behind by 1 second from May 4 to Jun 11. If sub-second absolute time-tag accuracy of the data samples is a not a concern, then you can ignore this log message. Otherwise, here are the gory details...
The data system was replaced on the turbulence tower on May 4.
The new system is running a new version (4.2.6p1) of the NTP (network time protocol) service. NTP on the data system is configured to use the attached GPS (Garmin 25-HVS) as a reference clock. NTP reads the NMEA messages from the GPS, which contain the absolute time, at a precision of a second, and it monitors the PPS (pulse-per-second) signal from the GPS. The leading edge of the PPS has approximate 1 microsecond absolute accuracy. Using the two inputs, NTP can condition the embedded data system clock to an absolute accuracy which is typically better than 300 microseconds.
The NMEA messages from the 25-HVS have a roughly 0.4 - 0.8 second lag, meaning the NMEA message for 00:00:00 arrives at the data system between 0.4 and 0.8 seconds late, at sometime after 00:00:00.4
The new version of NTP must be passed a parameter, known as "time2", specifying the approximate lag in seconds of the NMEA messages. If the value is left as the default, 0.0, then NTP assigns the time of a PPS with the time of the most recently received NMEA message, which results in a Linux system clock that is exactly 1 second behind absolute time.
On Jun 11 I detected this issue when fiddling with a data system in the FLAB parking lot, where I also had access to a NTP server on the network.
Here's the last 2 points of data from the GPS on the old system on May 4 at 18:33:34 UTC. There is a gap of 3848 seconds while the data system was swapped out, and the first 2 GPS data points from the new system at 19:37:42.
data_dump -i 1,30 -A manitou_20100504_120000.bz2 | more
...
2010 05 04 18:33:34.7163   1.127      73 $GPRMC,183334,A,3906.0321,N,10506.3310,W,000.0,289.2,040510,010.5,E*60\r\n
2010 05 04 18:33:34.8746  0.1583      72 $GPGGA,183334,3906.0321,N,10506.3310,W,1,06,1.7,2396.4,M,-21.3,M,,*46\r\n
2010 05 04 19:37:42.3816    3848      73 $GPRMC,193743,A,3906.0352,N,10506.3241,W,000.0,000.0,040510,010.5,E*65\r\n
2010 05 04 19:37:42.5430  0.1614      72 $GPGGA,193743,3906.0352,N,10506.3241,W,1,06,4.2,2391.6,M,-21.3,M,,*47\r\n
The absolute time in the NMEA messages is the HHMMSS field between the commas after $GPRMC or $GPGGA. The $GPRMC NMEA message for 183334 was received and timetagged with a system clock value of 18:33:34.7163, which is a typical lag of .7163 seconds. After the gap, the first NMEA message with a value 193743 was assigned a timetag of 19:37:42.3816, indicating that the system clock was 1 second early.
On Jun 11 the value of the "time2" parameter was changed to 0.8 seconds and ntp restarted on the data system. By looking at the data_dump it appears that NTP corrected the system clock around 20:53:43 UTC.
2010 06 11 20:53:42.1074  0.9465      73 $GPRMC,205343,A,3906.0359,N,10506.3337,W,000.0,206.3,110610,010.5,E*66\r\n
2010 06 11 20:53:42.2698  0.1624      72 $GPGGA,205343,3906.0359,N,10506.3337,W,1,06,1.6,2398.5,M,-21.3,M,,*4F\r\n
2010 06 11 20:53:44.7440   2.474      73 $GPRMC,205344,A,3906.0358,N,10506.3338,W,000.0,206.3,110610,010.5,E*6F\r\n
2010 06 11 20:53:44.9072  0.1632      72 $GPGGA,205344,3906.0358,N,10506.3338,W,1,06,1.6,2398.7,M,-21.3,M,,*44\r\n
NTP was adjusting the Linux system clock for a minute or two prior to 20:53:43 and so the accuracy of those timetags is unknown. For example, the 20 Hz sonic data shows a jump forward of 1.598 seconds at this time. It looks like NTP and the Linux kernel first slowed the the clock down for a period of time and then made a ~1.55 second jump forward.
data_dump -i 1,100 -H ../raw_data/manitou_20100611_120000.dat | more
...
2010 06 11 20:53:42.7157 0.05111      12 48 00 26 02 fc 01 d7 09 d0 0f 55 aa
2010 06 11 20:53:42.7647 0.04894      12 55 ff 9a 01 64 02 e8 09 d1 0f 55 aa
2010 06 11 20:53:44.3625   1.598      12 8a fe f0 01 45 02 53 0a d2 0f 55 aa
2010 06 11 20:53:44.4117 0.04916      12 d9 ff 35 02 0d 02 8e 0a d3 0f 55 aa
2010 06 11 20:53:44.4631  0.0514      12 37 01 42 02 d9 01 b9 0a d4 0f 55 aa
After the correction on Jun 11 the absolute accuracy of the data system clock should be generally better than 300 microseconds.
Much ado about nothing...
The 7m TRH has been sick since about Jun 23. It looks like a bad RS232 connection. The data is good for periods of time, then garbage.
Here's a bit of data where it was in a and out:
data_dump -A -i 1,220 manitou_20100627_120000.dat  | more


2010 06 27 13:44:10.4165   22.59      20 \xfc\xfe1\xfe~3f\xf04984\xe02929\r\n
2010 06 27 13:44:12.0258   1.609      26 \xfc\xfe10.\xf08\xe088\xee33 4985 2929\r\n
2010 06 27 13:44:13.6407   1.615      29 T\xde\xf8?\xfe10.08 88.30 4985 2928\r\n
2010 06 27 13:44:15.2587   1.618      31 TRH009 10.06 88.30 4984 0928\r\n
2010 06 27 13:44:16.8703   1.612      31 TR\xf8\xf00\xff\xe010.06 88.33 4984 \x00929\r\n
2010 06 27 13:44:18.4900    1.62      30 TR\xf80\x06\xff10.06 88.35 4984 0830\r\n
2010 06 27 13:44:20.1026   1.613      62 TRH009\xe010.04 88.37 4982 09\xc0\x8b\xd6\x98\xf8TR\xf800\xf9\xe010.05 88.48 4
983 093\x05\r\n
On May 13, two sapflow sensors were installed on each of 12 trees approx. 50 m SE of the turbulence tower. Heat flux data will be downloaded at approx. 2-week intervals, and anyone interested in the data should contact Jia Hu (jiahu@ucar.edu). At some point, heat fluxes will be converted to sapflow data and available to help constrain water flux measurements made at the turbulence tower. Sometime in the next couple of weeks, soil moisture sensors (3 depths) will also be installed at two locations within the sapflow array.
16m TRH has been missing since May 21, 2010 and acting up since as early as May 11.
Upon arrival, there was no fan operating on the 16m TRH. Determined that the coupling between the 5 and 15m cables going to the 16m TRH had taken on water and/or was corroded. Replaced 15m cable (upper section) of the cabling to the 16m TRH due to the corrosion. Bottom 5m cable should be replaced too. Kurt taped the current coupling and inserted a drip loop. Should be ok for a while. Verified that the TRH was now operational and that data was now being collected.
Also replaced TRH external housing (shield, fan, firmware, etc), but used the original SHT sensor in this new housing.
Work today finalized by about 1pm LT.
On site: Kurt Knudson and Ned Patton
Just wanted to mention that we're looking into the butanol issue with seatainer 4. Butanol is used for the particle counters, and we are attempting to get rid of as much of the vapors as possible.
ACD had a catastrophic failure of the laptop controlling the particle size instrument. Last good data from that is May 3rd at 9:10pm. That system is down until we can replace the computer.
Karl Schwenz, Chris Golubieski, Gordon Maclean
Objectives:
- Diagnose and fix reason that system has been offline for last few days (no data in Boulder after April 27).
- Replace data system box in order to take the old box back to Boulder for a tuneup.
- Replace top TRHs which have not been working well. Add new radiation shields.
- Replace barometer with external unit.
- Make anti-climb door easier to latch.
Arrived at site, May 4 10:30.
Chris climbed tower and replaced the TRH transducer/PIC units, and replaced the radiation shields with picnic plates ![]() .
.
height |
previous |
new |
|---|---|---|
2m |
TRH012 |
no change |
7m |
TRH011 |
TRH009 |
16m |
TRH015 |
TRH004 |
30m |
TRH013 |
TRH001 |
43m |
TRH016 |
TRH006 |
Replaced the barometer. New unit is B1 with chassis outside of the DSM. Old was B9, inside the DSM.
Karl fixed the anti-climb door. Works like a breeze now. If door is ever difficult to latch give a hand knock on the bottom right corner to shift it to the left. Hinge bolts should be replaced with correct size on a future visit.
System was up and taking data. (Reporting about 1000 spurious interrupts per second, then later 500 after Chris replaced some TRHs). The pocketec disk has data files for April 28 to the present, so no loss of data. Could not ping manitou server, 192.168.100.1, at other end of fiber link. Power cycling the fiber/copper media converter at the tower did not help. In retrospect I should have also cycled power on the 5 port switch. Cycling power on the media converter in the seatainer also did not bring it back. Only the power LED was lit on the converter at the tower, not SDF (signal detect fiber), SDC (signal detect copper), or RXC/F (receive copper/fiber). I am not sure whether the SDC LED was on in the seatainer.
Site note: There is a strong smell of what I believe is butanol in the seatainer where the turbulence tower fibers are terminated. This is the first seatainer as one drives into the site. There are several butanol bottles in that seatainer.
The manual for the fiber/copper network converters (Transition Networks, model E-100BTX-FX-05) describes the dip switch options. I've cut and pasted some of the manual to the end of this entry. It seems that we should disable the link pass-through and far-end fault options on both converters. Link pass-through and far-end fault options can cause a copper interface to be disabled if a fault is detected on the remote copper interface or on the fiber. These options appear to be for a building network with good network monitoring equipment. Perhaps a power outage, cable disconnect, or powering down a network switch could cause the converters to think there is a fault in the copper ethernet or the fiber, and then the copper interfaces would be disabled. The manual says nothing about whether the interfaces are automatically brought up if the fault disappears.
Dip switch 1 is auto-negotiation of speed and duplex and that was left enabled=UP. Set switches 2, 3 and 4 DOWN on both converters, to disable pause control, link pass-through and far-end fault.
Pause control should be enabled if ALL devices attached to the media converters have it. I didn't know if the ethernet switches have it, so I disabled it (dip switch 2 DOWN). I now think that was a mistake and that all modern ethernet switches have pause control. So I suggest that we set switch 2 UP on both units, and power cycle them on the next visit.
With 1=UP, and 2,3,4=DOWN and power cycling both units, the link came back and we could ping the seatainer. Swapped data boxes and then couldn't ping. Eventually power cycled the 5 port switch at the tower and things worked again.
New data box is swapped in and all sensors are reporting. Taking the original pocketec back to Boulder so the system at the tower now has a different pocketec unit.
From the manual for the converters:
Pause Control
The Pause feature can improve network performance by allowing one end of
the link to signal the other to discontinue frame transmission for a set period
of time to relieve buffer congestion.
NOTE: If the Pause feature is present on ALL network devices attached to the
media converter(s), enable the Pause feature on the media converter(s).
Otherwise, disable the Pause feature

Link Pass-Through
The Link Pass-Through feature allows the media converter to monitor both the
fiber and copper RX (receive) ports for loss of signal. In the event of a loss of
an RX signal (1), the media converter will automatically disable the TX
(transmit) signal (2), thus, “passing through” the link loss (3). The far-end
device is automatically notified of the link loss (4), which prevents the loss of
valuable data unknowingly transmitted over an invalid link.


near-end <-1-> local media -2->  remote media <-3-> far end
device         converter   <-4-  converter          device

original fault   local media cvtr       remote disables
on copper link   sends loss signal      ethernet device
(1)              over fiber (2)         (3)

Far-End Fault
When a fault occurs on an incoming fiber link (1), the media converter
transmits a Far-End Fault signal on the outgoing fiber link (2). In addition the
Far-End Fault signal also activates the Link Pass-Through, which, in turn,
disables the link on the copper portion of the network (3) and (4).

                      original
                      fault on
                      fiber (1)
near-end <-4-> media     -1->  media converter <-3-> far end
device         converter <-2-  converter             device
               A               B

media converter                               media converter B
A disables copper                             detects fault on (1),
link (4)                                      disables the copper (3)
                                              sends far-end fault
                                              signal to A over fiber (2)
TRH at 16 meters has had sporadic problems since Apr 8 07:00 MDT.
Over Apr 10,11 and 12 it seems to come alive in the warmest part of the day,
(at temps over 10C) and then fails as the temp falls in the evening. See plot below.
Here is a dump of some recent data (times in GMT).
Looks like the processor is getting reset, printing out its calibration
information when it boots. Perhaps the power is dropping out?
Corroded connection?
data_dump -i 1,320 -A manitou_20100411_000000.dat | more
2010 04 11 00:56:36.0258  0.3326      30 TRH015 7.77 36.73 4758 1178\r\n
2010 04 11 00:56:36.8640  0.8381      30 TRH015 7.79 36.69 4760 1177\r\n
2010 04 11 00:56:37.6940    0.83      30 TRH015 7.74 36.69 4755 1177\r\n
2010 04 11 00:56:39.9607   2.267      91 \x00\x00\x00\x00\x00\x00\x00\x00\x00\x00\x00\x00\x00\x00\x00\x00\x00\x00\x00\x00\x00\x00\x0
0\x00\x00\x00\x00\x00\x00\x00\x00\x00\x00\x00\x00\x00\x00\x00\x00\x00\x00\x00\x00\x00\x00\x00\x00\x00\x00\x00\x00\x00\x00\x00\x00\x0
0\x00\x00\x00\x00\x00\x00\x00\x00\x00\x00\x00\x00\x00\x00\x00\x00\x00\x00\x00\x00\x00\x00\x00\x00\x00\x00\x00\x00\x00\x00\x00\x00\x0
0\n
2010 04 11 01:00:58.2916   258.3      17 \r Sensor TRH015\n
2010 04 11 01:00:58.3121 0.02053      29 \rcalibration coefficients:\r\n
2010 04 11 01:00:58.3619 0.04973      21 Ta0 = -4.076641E+1\r\n
2010 04 11 01:00:58.4016 0.03978      21 Ta1 =  1.031582E-2\r\n
2010 04 11 01:00:58.4489 0.04731      21 Ta2 = -2.394625E-8\r\n
2010 04 11 01:00:58.4907 0.04176      21 Ha0 = -1.160299E+1\r\n
2010 04 11 01:00:58.5318 0.04105      21 Ha1 =  4.441538E-2\r\n
2010 04 11 01:00:58.5752 0.04345      21 Ha2 = -3.520633E-6\r\n
2010 04 11 01:00:58.6174 0.04219      21 Ha3 =  4.330620E-2\r\n
2010 04 11 01:00:58.6595 0.04213      21 Ha4 =  6.087095E-5\r\n
2010 04 11 01:00:59.3678  0.7083      24 \x00\x00\x00\x00\x00\x00\x00\x00\x00\x00\x00\x00\x00\x00\x00\x00\x00\x00\x00\x00\x00\x00\n
2010 04 11 01:02:12.1760   72.81      17 \r Sensor TRH015\n
2010 04 11 01:02:12.1931 0.01712      29 \rcalibration coefficients:\r\n
2010 04 11 01:02:12.2448 0.05173      21 Ta0 = -4.076641E+1\r\n
2010 04 11 01:02:12.2831 0.03822      21 Ta1 =  1.031582E-2\r\n
2010 04 11 01:02:12.3282 0.04517      21 Ta2 = -2.394625E-8\r\n
2010 04 11 01:02:12.3694 0.04114      21 Ha0 = -1.160299E+1\r\n
2010 04 11 01:02:12.4133  0.0439      21 Ha1 =  4.441538E-2\r\n
2010 04 11 01:02:12.4565 0.04324      21 Ha2 = -3.520633E-6\r\n
2010 04 11 01:02:12.4920 0.03553      21 Ha3 =  4.330620E-2\r\n
2010 04 11 01:02:12.5381 0.04609      21 Ha4 =  6.087095E-5\r\n
2010 04 11 01:02:12.8732   0.335      30 TRH015 7.65 37.52 4746 1200\r\n
2010 04 11 01:02:13.7034  0.8302      30 TRH015 7.59 37.47 4740 1199\r\n
2010 04 11 01:02:14.5444   0.841      30 TRH015 7.59 37.44 4740 1198\r\n
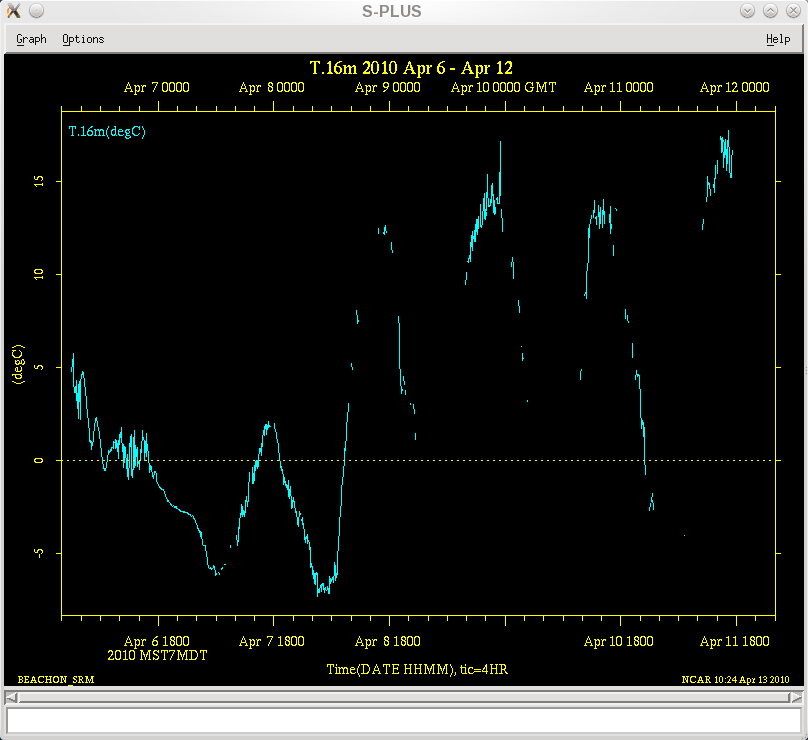
The TRH at 30m is acting up. Here is the data when it goes bad:
data_dump -i 1,420 -A manitou_20100314_120000.dat | more
2010 03 14 13:17:07.8073 0.82 31 TRH013 -4.18 88.21 3565 2887\r\n
2010 03 14 13:17:08.6281 0.8208 31 TRH013 -4.17 88.21 3566 2887\r\n
2010 03 14 13:17:09.4474 0.8194 31 TRH013 -4.19 88.21 3564 2887\r\n
2010 03 14 13:17:10.2680 0.8206 31 TRH013 -4.17 88.21 3566 2887\r\n
2010 03 14 13:17:11.0874 0.8194 31 TRH013 -4.17 88.19 3566 2886\r\n
2010 03 14 13:17:11.6405 0.5531 32 TRH013 560.79 -10099.38 -1 -1\r\n
2010 03 14 13:17:12.1912 0.5508 33 TRH013 560.79 -860.91 -1 29695\r\n
2010 03 14 13:17:12.7506 0.5594 33 TRH013 560.79 -728.27 -1 28671\r\n
2010 03 14 13:17:13.3080 0.5573 33 TRH013 560.79 -602.91 -1 27647\r\n
2010 03 14 13:17:13.8614 0.5534 33 TRH013 560.79 -602.91 -1 27647\r\n
2010 03 14 13:17:14.4180 0.5565 33 TRH013 560.79 -484.86 -1 26623\r\n
And when it comes back:
2010 03 14 13:25:23.2688 0.5591 33 TRH013 560.79 -374.10 -1 25599\r\n
2010 03 14 13:25:23.8211 0.5522 33 TRH013 560.79 -484.86 -1 26623\r\n
2010 03 14 13:25:24.3795 0.5584 33 TRH013 560.79 -602.91 -1 27647\r\n
2010 03 14 13:25:24.9310 0.5516 33 TRH013 560.79 -602.91 -1 27647\r\n
2010 03 14 13:25:25.6989 0.7679 35 TRH013 -4.18 -1418.74 3565 27647\r\n
2010 03 14 13:25:26.5223 0.8234 31 TRH013 -4.17 88.04 3566 2880\r\n
2010 03 14 13:25:27.3417 0.8193 31 TRH013 -4.17 88.06 3566 2881\r\n
2010 03 14 13:25:28.1604 0.8188 31 TRH013 -4.17 88.04 3566 2880\r\n
Note that the delta-Ts when it is working correctly are around 0.82 secs and when it goes
nuts are around 0.55 sec. Steve thinks it may be a PIC processor issue.
Ned Patton, Sylvain Dupont, Gordon Maclean
March 12, 2010, 9:15 MST arrived at tower
Plan: correct problem of spotty CNR1 data, replace TRH fan at 2 meters
rserial on port 19 showed no CNR1 data. Power cycled CNR1 by
unplugging/replugging. No data.
Switched CNR1 cable to port 5 (2 meter TRH's port). CNR1 works on that port.
Changed config to use unused port 14 as the CNR1 port. CNR1 also works
on that port.
Power on port 19 looked OK, and TRH worked on that port.
9:27 MST: new fan in 2 meter TRH.
Ned determined that the 7 meter TRH fan was noisy, so we replaced
that too.
System voltage, as measured by the DVM in the serial test box, fluctuates
from 11.8 to 13.2 volts, with a period of something like 10 seconds.
I assume that is due to the trickle charger.
At one point I saw the CNR1 data pause for about 20 seconds, and then
several records came out at once. That was after it had been running
for a while - not at startup.
Off tower at 10:30. Left site after a tour up the walkup tower and
chem seatainer.
On Feb 4, logged into system from Boulder to verify the serial numbers of the licors:
port |
SN |
assumed height |
|---|---|---|
2 |
1163 |
2m. Moved from port 14, 30m on Feb 2 |
7 |
1166 |
7m |
20 (was 17) |
1167 |
16m |
14 |
now disconnected |
|
11 |
1164 |
43m |
This agrees with the configuration previous to Feb 2, and the changes of Feb 2: move of the 30m unit (SN1163) to 2m, and the move of the cable from the 16m unit (SN1167) from port 17 to port 20 on the new data system box.
To check the licor serial numbers do:
adn                                # shut down data process
minicom ttySN                      # N is port number
ctrl-a f                           # sends break
(Outputs (RS232 (EOL "0A0D")))     # enable carriage return in output
(Coef ?)                           # display serial number
(Outputs (RS232 (EOL "0A")))       # new-line termination, resume output
ctrl-a q                           # quit minicom
aup                                # restart data process
ds                                 # wait 10-15 seconds
ctrl-c                             # verify sampling rates
Feb 2, 2010: Patton, Golubieski, Maclean on site at 10:30 MST
Planned tasks:
- Move Licor 7500 from 30 meters to 2 meters
- Investigate why data system can't sample 4 7500's at 20 Hz
- Measure guy tensions
Noticed a high-pitch sound from a TRH fan. Chris determined it was the 16m TRH. The propeller had come off the shaft, and was not repairable. Swapped the 16m and 2m TRHs, so that it will be easy for someone to replace the low unit.
Therefore the TRH at 16m has not had fan ventilation for an unknown period of time up to Feb 2, and likewise for the 2m TRH after Feb 2, until it is replaced.
Initial licor 7500 serial port configuration:
port |
height |
status |
|---|---|---|
2 |
2m |
not connected |
7 |
7m |
OK, 9600 baud, 10Hz |
17 |
16m |
OK, 9600 baud, 10Hz |
14 |
30m |
OK, 9600 baud, 10Hz |
11 |
43m |
OK, 9600 baud, 10Hz |
Looked at RS232 transmit signal from Licors with oscilloscope and a serial breakout box. Ports 17,11 and 7 all showed clean, square signals, ranging from -7V to +7V.
Moved 30m licor to 2m.
Looked at the signal ground of the 2m licor inside the Licor box, with the oscilloscope probe ground connected to power ground. Saw hair-like spikes with a range of +- 1V at the bit frequency of the signal. By shorting signal ground to power ground we could get rid of these spikes.
Temporarily switched the cables on the 7m and 2m Licors, so that the 2m was plugged into port 7. Port 7 is on a Diamond Emerald serial card, which are the ports (5-20) that have not been working at 20Hz.
Up'd the sampling frequency of the 2m licor in port 7 to 20Hz, 19200 baud. Saw an increase in "spurious interrupts" which did not diminish when we shorted the signal and power grounds together, so those spikes do not seem to be the issue.
Swapped dsm chassis boxes, replacing box #1 with box #8. Also swapped PC104 stacks. This configuration did not work well at all, with data_stats showing bad data rates. Swapped original PC104 stack back, and still saw problem. Eventually noticed that the input from the licor on port 17 had lots of jibberish. Moved this to port 20 and it cleaned up and the data_stats looked OK. So now believe this sampling issue was due to a bad port 17 on the new box and not an issue with the pc104 stack.
The PC104 stack (which is what has been at the site all along):
card |
SN |
|---|---|
viper |
#7, 3284 |
serial ports 5-12, EMM-8M |
W250017 |
serial ports 13-20, EMM-8M |
W237191 |
power |
W248060 |
This stack is now in box #8, which means it has a new Viasala barometer. rserial shows this is unit 9: B9 752.08 5.2\r\n. The barometer in box#1 was unit B7.
Tried increasing the sampling rates of the licors to 20 Hz, 19200 baud. The number of spurious interrupts increased to somewhere around 600+. The system was generally keeping up, as shown by data_stats, but sometimes things looked bad. So reduced the rates back to 10Hz, 9600 baud. The system runs well, with a background level of around 170 spurious interrupts/sec, as it was before this visit.
The licor message length is between 44 and 49 characters. So at 20Hz this is roughly 10bits * 49 * 20/sec = 9800 bits/sec, so we must use 19200 baud instead of 9600 when sampling at 20 Hz.
Around mid-day Ned and Chris measured the guy tensions and those values have been added to the matrix in the blog entry.
Conclusions
The problem with sampling Licors at 20Hz seems to be a data system issue, in that it cannot keep up with the total serial interrupt load from the sensors on the tower. Based on what we saw on the scope, it is not an issue with the quality of RS232 signals. Since it didn't change when we swapped system enclosures and the PC104 stacks, it is not related to interface panels, the CPU or the serial cards. The power to the Licors looks good.
Our simulation of this configuration in the lab did not include 5 TRHs (1 sample/sec), the barometer (1/sec) or the GPS (2 samples/sec). The addition of these inputs seems to break the camel's back.
The 2m licor connected to /dev/ttyS2 was removed today, and the licors at 16 and 43 meters were reconnected to ports /dev/ttyS17 and /dev/ttyS11 by a BEACHON helper.
By checking the serial numbers, with the (Coef ?) command, and comparing against the earlier LICOR log entry, we could determine remotely what unit is connected to what port. Note that the licors at 16 and 43 meters are switched from the previous configuration.
port |
height |
SN |
|---|---|---|
ttyS2 |
removed |
|
ttyS7 |
7m |
1166 |
ttyS11 |
43m |
1164 |
ttyS14 |
30m |
1163 |
ttyS17 |
16m |
1167 |
The data system from the time the licors on port 11 and 17 were enabled on Dec 2, until the next morning, Dec 3 at 10:26 AM MST was configured in the old way, so the data from the licor on port 17, SN 1167 was given an id of 1,310, and the data from the licor on port 11, SN 1164 was given an id of 1,510. So the licor data at 43 meters and 16 meters is cross-identified during that time period.
Basic 7500 configuration:
(Outputs (RS232 (EOL "0A") (Labels FALSE) (DiagRec FALSE) (Ndx FALSE) (Aux FALSE) (Cooler FALSE) (CO2Raw TRUE) (CO2D TRUE) (H2ORaw TRUE) (H2OD TRUE) (Temp TRUE) (Pres TRUE) (DiagVal TRUE)))
First test: 4 licors running at 10Hz, 19200 baud
(Outputs (BW 10) (RS232 (Freq 10.0) (Baud 19200)))
This resulted in around 1200 spurious interrupts being reported in /var/log/isfs/kernel
Second test: 4 licors running at 5 Hz, 19200 baud
(Outputs (BW 5) (RS232 (Freq 5.0) (Baud 19200)))
This resulted in around 300 spurious interrupts/sec being reported in /var/log/isfs/kernel
Third test: 4 licors running at 5 Hz, 9600 baud
(Outputs (BW 5) (RS232 (Freq 5.0) (Baud 9600)))
This resulted in usually less than 50 spurious interrupts/sec being reported in /var/log/isfs/kernel. The kernel does not report more than 50/s, so there are very few reports of spurious interrupts showing up in /var/log/isfs/kernel.
Left it running at this setting.
Current values from /proc/tty/driver/serial:
2: uart:XScale mmio:0x40700000 irq:13 tx:543 rx:1136277465 fe:1947 RTS|DTR

7: uart:ST16654 port:F1000110 irq:104 tx:1111 rx:1153977325 fe:41917 RTS|DTR

11: uart:ST16654 port:F1000130 irq:104 tx:1585 rx:3762900 fe:21542 RTS|DTR

14: uart:ST16654 port:F1000148 irq:104 tx:1549 rx:575482383 fe:3996 RTS|DTR

17: uart:ST16654 port:F1000160 irq:104 tx:1079 rx:2059346 fe:2312 RTS|DTR
Next morning, tried fourth test:
Fourth test: 4 licors running at 10 Hz, 9600 baud
(Outputs (BW 10) (RS232 (Freq 10.0) (Baud 9600)))
This resulted in around 400-500 spurious interrupts/sec being reported in /var/log/isfs/kernel. The system is keeping up, top shows an idle value of ~ 70%.
Here are the current values from /proc/tty/driver/serial. The number of framing errors is staying steady at this baud rate:
7: uart:ST16654 port:F1000110 irq:104 tx:1371 rx:1169013368 fe:41917 RTS|DTR

11: uart:ST16654 port:F1000130 irq:104 tx:2133 rx:18900757 fe:21542 RTS|DTR

14: uart:ST16654 port:F1000148 irq:104 tx:1809 rx:590564461 fe:3997 RTS|DTR

17: uart:ST16654 port:F1000160 irq:104 tx:1339 rx:17587617 fe:2321 RTS|DTR
Testing at FLAB
We've attempted to simulate the turbulence tower data acquisition configuration at FLAB, with an adam sampling 5 CSAT3 sonics at 20Hz and 1 Licor 7500 whose transmit and signal ground lines are forked to 5 separate serial ports. There is no GPS, CNR1, barometer or 5 TRHs on the test adam. We see no spurious interrupts, and the data system is keeping up with the 1x5 Licor set to 20Hz, 19200 baud. top shows a system idle value between 97 and 80%.
top on the adam at the turbulence tower shows 65-79 % idle. Other than the additional low rate serial sensors there is no difference between the 2 systems. They are both writing the full archive to a usbdisk.
18Nov09 Site Visit: CG, KK, JM
- Purpose: Install 5 Licor 7500's
- Power: We rearranged the power / batteries to accomodate the licors. A high current/trickle/equalize battery charger was connected directly to the battery chain and not through the solar/battery charge by using the last 'external battery' amp connector. This was because an excessive feedback impedance from the Morningstar charge controller was causing the commercial battery charger to not see the proper battery voltage preventing it from starting up to supply the loads (ie battery charger was 'too smart'). A regulated, current limiting supply wouldn't care and could be cranked up to a voltage more closely approximating solar panels (ie 14-15vdc). There are now 3 batteries in the string. A power distribution Tee was connected to the 'fused load' of the primary battery box with one secondary going to the Adam and the other going to the 5 Licor chain. The licors are being powered directly because earlier tests showed that the voltage drop in our smaller gauge isfs serial cables was excessive and causing the higher-level licors to not have adequate supply voltage. The internal solar-battery-charger is being used only as a 'low-voltage-disconnect' switch for these 2 loads.
- Licors Installed. The 43m,30m serial cables had been added before, so we only installed those for 2.5,7.5,15m
Level |
Licor S/N |
Adam ttySx |
Freq,BPS |
Comments |
|---|---|---|---|---|
43m |
1164 |
17 |
10,9600 |
Disconnected from panel, diamond board #2 |
30m |
1163 |
14 |
10,9600 |
Refurbished recently |
15m |
1167 |
11 |
10,9600 |
Disconnected from panel, diamond board #1 |
7.5m |
1166 |
7 |
20,19.2k |
|
2.5m |
0813 |
2 |
20,19.2k |
Refurbished recently, On Viper board |
- Licor Ingest Problems: After installing the licors we observed many 'spurious interrupts' on the adam console. These were caused by the licors, especially at 43, and 15m, but those were not the only ones. At first we thought the cables may have been 'funky' and tried removing some cable ties to no avail. When we disconnected the worst offenders, the adam was able to do a data_stats and the statistics for the licors looked ok, as did the console rserial printouts. However the diamonds/adam was having clear difficulty. Gordon was able to login to the system and reprogram a few of the sensors to try to slow them down to overcome these interrupts, and although at first it appeared that worked, it did not. .... Pow-wow time. I'm suspecting a power/serial ground issue combined with the serial driver circuit on the licors, although the diamond boards may be culpable. It is noteworthy that there are 2 different diamond boards involved in these. We left the system running but with the 15 and 43m licors disconnected.
Here are my notes from this week on the first servicing we've ever done on our Li7500s.
Note that S/N 0813 and 1166 came back from LiCor this summer after being repaired (from lightning damage), so no service was performed on them.
The following all was done using LiCor's software (installed on the Aspire). Before service:
S/N |
Last Cal |
CO2 zero |
CO2 span |
H2O zero |
H2O span |
AGC |
|---|---|---|---|---|---|---|
0813 |
Didn't read |
|
|
|
|
|
1163 |
24 Oct 06 |
0.8697 |
0.9968 |
0.8468 |
0.9946 |
49% |
1164 |
24 Oct 06 |
0.8883 |
1.017 |
0.8601 |
0.9980 |
50% |
1166 |
10 Jul 09 |
0.8896 |
1.0051 |
0.8583 |
0.9969 |
53% |
1167 |
24 Oct 06 |
0.8768 |
0.9978 |
0.8678 |
0.9961 |
48% |
On the afternoon of 10 Nov 09 (after Chris&Jen recovered them from MFO), I dumped the dessicant/scrubber (Magnesium Perchlorate; Ascarite2) from the bottles of 1163, 1164, 1167 and replaced with new Drierite and Ascarite2, following the manual instructions. I put a sticky label on one bottle in each sensor with this replacement date. Instructions say to have the sensors run for at least 4 hours before proceeding with calibrations, so they were all left overnight powered on.
On the afternoon of 11 Nov (~23 hours after changing chemicals), we went through the calibration procedure using a cal lab nitrogen tank for zero CO2 and H2O and a tank I borrowed from Teresa Campos/Cliff Heizer at 404.316ppmV for span CO2. Both of these were supplied to the 7500 using the LiCor calibration tube at a flow rate of about 1.3 lpm. Span H2O was achieved by placing the entire 7500 head in the Thunder chamber at T=25C, RH=80%, which should be a dewpoint of 21.31C. Since the electronics box was outside the chamber, the calibration tube was also placed in the chamber (though not in the optical path) to measure pressure. Since it seemed to take a long time (25 & 50 min, respectively to calibrate 1167 and 1163), we used the calibration tube's temperature reading when we calibrated 1164 the next day. This sped things up a bit. The calibration in the Thunder took long enough that 1164 was done the next morning. The new readings were:
SN |
Cal Date |
CO2 zero |
CO2 span |
H2O zero |
H2O span |
|---|---|---|---|---|---|
1163 |
11 Nov 09 |
0.8709 |
1.0082 |
0.8510 |
1.0229 |
1164 |
12 Nov 09 |
0.8902 |
1.0233 |
0.8635 |
1.0008 |
1167 |
11 Nov 09 |
0.8770 |
1.0207 |
0.8732 |
0.9986 |
AGC values were not logged, but noted to be within 1% of the earlier readings (even with the tube on).
With one exception, these values are higher than before service, indicating more absorption now. I note that I didn't clean the optics prior to this calibration, which probably should have been done, but spot checks of a few of the sensors looked pretty good.
Chris also ran 0813 and 1166 into the chamber (with a dewpoint still at 21.31C) and found that these sensors showed dewpoints of 22.07C and 21.45C, respectively. I'm a tiny bit concerned about this value from 0813.
Note that the LiCor software changed the instrument settings. They will be reset before (re)deployment at MFO.
Nov 9, 12:30 MST.
Per Steve Oncley, increased the sampling rate of the Licor 7500 at 43 meters.
It is the only unit connected right now.
Commands to change the sampling rate:
# shut down data process
adn

# adn powers off port 17, power it back on.
eio 17 1

# start minicom
# The default baud rate of minicom on that port is 9600, which is what the 7500
# uses after it is sent a break. To set it to 9600 explicitly, use ctrl-A pe.
# Use ctrl-A minicom commands to turn on local echo (e), line wrap (w) and send a break(f).
# Set bandwidth to 20 and RS232 output frequency to 20.
# Set terminator to 0A (newline):

minicom ttyS17
ctrl-A pe
ctrl-A e
ctrl-A w
ctrl-A f
(Outputs (BW 20) (RS232 (Freq 20.0)))
ctrl-A f
(Outputs (RS232 (EOL "0A")))
ctrl-A f
(Outputs ?)
ctrl-A q

# minicom should now be finished

# power off port 17
eio 17 0

# start data process. This will power up port 17
aup

# wait a bit, then
ds
ctrl-C


# If the 7500 doesn't respond, try power cycling it:
eio 17 0
eio 17 1
On site: Golubieski, Semmer, Militzer, Maclean. Dave Gochis was
also at the tower site, installing soil sensors.
Installed splint at ding in tower upright.
Reinstalled TRH transducers in ventilation units at all levels.
Started installing Licor 7500's. At 43 meters, S/N 1167, port ttyS17.
Measured total power draw at data system, prior to and after unit 1167
was installed:
|
|
|
Power |
Add'l Power |
|---|---|---|---|---|
without 43m 7500 |
13.0 V |
1.4 A |
18.2 W |
|
with 43m 7500 |
12.6 V |
3.0 A |
37.8 W |
19.6 W |
settled to |
12.8 V |
2.3 A |
29.4 W |
11.2 W |
Measured power draw of the 43 meter 7500 only, with serial line power meter at
the adam:
43 meter 7500 |
12.4 V |
.87 A |
10.8 Watts |
|---|
Tried to prepare units 813 and 1163 for installation at 30 meters, but could not get them to boot and run with required length of cable. Red LED at circuit board would stay on, or blink on and off. It is supposed to go off once the unit is running. Measured 8 V at the end of 30 meter cable with unit attached.
Installed S/N 1163, and 1164 at 30 and 16 meters, but witout data/power cables.
level |
Licor 7500 S/N |
status |
|---|---|---|
43m |
1167 |
port 17, working |
30m |
1163 |
not cabled |
16m |
1164 |
not cabled |
7m |
|
|
2m |
|
|
DC power supply in the enclosure that is charging the batteries is rated at 3 A, which will not be large enough to drive system with 5 Licor 7500s, since each Licor needs about 0.9 A.
The beacon was running off a separately charged battery with an inverter. Connected the beacon directly to AC power and added the battery to the bank of 2 that power the data system and tower sensors. So the beacon is not a load on the DC supply anymore, and there are 3 batteries providing power to the tower, that are charged by the DC supply via a charge controller.
Installed Kipp and Zonen CNR1 net radiometer. Data is being received. Distance from top of CNR1 boom to top of tower base plate is 22.38 meters. Chris said that per the bubble level indicator the unit is quite level.
Distance from top of CNR1 boom to top of 16 meter sonic is 6.31 meters. So the top of this sonic boom is at 22.38-6.31 = 16.03 meters.
Moved network switch from adam to power enclosure. Dave Gochis will probably use one of the ethernet ports for his Tsoil CR1000. After this switch, the fiber/copper media converter would not connect - even after several power cycles of converter and switch. Had to power cycle the media converter in the seatainer. This may mean that the fiber network will not always come up after a power outage without intervention.
Untaped pressure inlet (13:33 MST).
Updated NIDAS software on adam to version 5051M.
Installed anti-climb cage on tower.
On the Oct 15 visit, Kurt noticed that the inlet of the barometer
pressure port had been taped over, though the tape had peeled back
and was no longer covering the inlet hole. Pressed the tape
back down, but it probably won't stay.
It was probably taped on Oct 1 when the TRHs were removed in anticipation
of a controlled burn.
So since Oct 1, the pressure data should not be trusted.
Oct 14. Arrived on site 10:55 MDT.
Kurt Knudson and Gordon Maclean (EOL) and Fabian Guerrero and Armando Cisneros from CISL/NETS.
Installed DC power supply in the power/network enclosure at turbulence tower. It is charging one battery for the beacon and two batteries for the data system and sensors.
Removed solar panels and other batteries from the site.
Fabian and Armando terminated and tested the fibers, installed fiber patch panels
at the tower enclosure and in the seatainer, and connected the fiber/copper media converters. The media converters are from Transition Networks, model E-100BTX-FX-05. I believe that they are the standard temperature models (not the "HT", versions), and so their temperature range is 0 to 50 degC. At the tower the converter is in the metal enclosure. Hopefully the converter's own heat and heat from the DC supply will keep it warm enough.
The 30 foot run of ethernet cable from the enclosure to the data system at the tower is currently an indoor-rated cat 5 cable, with RJ45 connectors on each end. It is routed through a 1/2 inch hole in the side of the adam and through a knock-out in the bottom of the enclosure. It should be replaced with an outdoor rated cable through conduit to prevent critter chewing.
We removed the WIFI equipment and cables at the turbulence tower and the walkup tower.
Configured the data system with IP address 192.168.100.202. With the fiber link it is now directly on the 192.168.100 subnet.
The etherant (unit C) at the turbulence tower was not working. Saw no light on the power LED, but the DC-DC converter was delivering 15 V to the interface panel inside the adam.
The adam had been working, though it wasn't reachable over the wifi because of the problem with etherant C. The pocketec (#5) contained 12 days of data. Swapped in pocketec #3 and brought back #5 to Boulder.
Updated the NIDAS software on the system, revision 4985.
Measured the power draw of the data system with 5 sonics, GPS, barometer, PC104 stack and pocketec disk (no etherant): 12.8 Volts, current: 1.4 to 1.61 A.
The fiber link was operational at 2:20 MDT. Left site shortly after. Late lunch at the BuckSnort in Sphinx Park.
Paul Painter from Green Mountain Falls Electric completed the installation of the electrical enclosure at the turbulence tower, and the connecting of the power cables at either end on October 7. So, line power should now be available at the turbulence tower.
The service should be 5 kVa, there should be two circuits each with outlets inside the enclosure and water proof outlets outside the enclosure.
Power cable and data cables between the walk-up and turbulence towers were trenched into position on Monday, October 5 2009. Connections at either end of the cables will be completed shortly.
Mostly Sunny. Cold and breezy.
Karl and I inspected "ding" in tower. Nothing was resolved of what could've done this dent. There's not paint/led/copper transfer for a bullet/arrow. It almost looks like somone tried to hang something over wrenched it. ??
TRH's sensors were removed and taken back to NCAR. Some of them were VERY dusty. I kept shields and cables all plugged in and at their heights. However, I did remove all TRH port fuses. So be careful when opening the ADAM box since the fuses are just loose inside.
Taped pressure port.
Removed one battery from the beacon battery bank and added it to the ADAM battery bank. So four batteries on ADAM and two on beacon. Also took a rack of panels(good ones) from the beacon and moved it to the two banks for the ADAM. So hopefully where they are positioned we will have more charging throughout the day. Beacon's one rack is getting morning and some afternoon sun. All batteries seem to be around 12.5V. ADAM was down when we arrived (~10:30).
Took guy-wire tensions. Will add readings to the guy-wire sheet. They look good!
Boom angles (rough shots). Starting from 2m to 45m (in degrees). 40.9, 46.3, 41.9, 72.9, 109.3. I don't feel very comfortable with the data scope. We may want to shoot with theodolite. Add 180 degrees to these angles.
Removed Oncley's trailer from ACD site.
Fire line is covered again with pine needles. FYI.
The 16 meter TRH did not survive the power outages on Sep 16.
It was running fine up to the 03:20 am dropout but has just
given a few sporadic points since.
I logged into the manitou system and tried rserial to port 11
(rs 11), but got nothing back.
The data system at manitou died at around 03:20 am MDT on Sep 16,
and and came back at 8:30 am. It died again at 10:34 pm Sep 16 and
came up at 8:30 the next morning. Looks like we're not
getting enough solar charging.
It has stayed up since Chris G swapped batteries on Sep 18.
Stopped by the 45m tower and noticed a fire line that has been scratched around the tower and anchors. The line comes about five feet from anchors and approx. seven feet from solar panels. Looked a little close if the burn gets out-of-hand. Also swapped NDAQ and beacon batteries. The batteries on beacon were around 13V while the NDAQ were at 11V. The solar panels for the NDAQ were really never in the sun while I was there (~9 - 10am) with the beacon panels were in full sunlight the whole visit time.
Firelines |
||
|---|---|---|

|

|
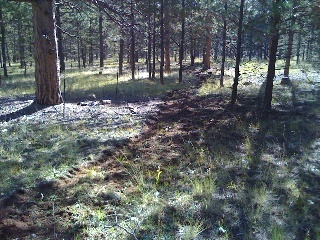
|
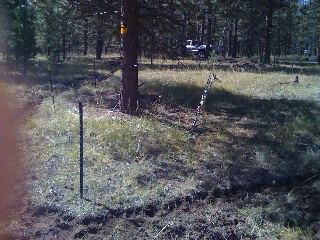
|
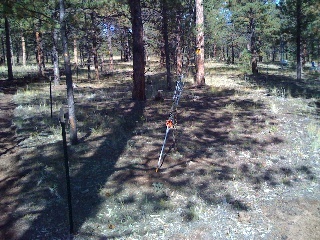
|
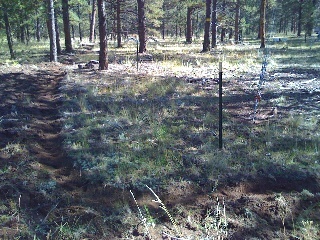
|

|
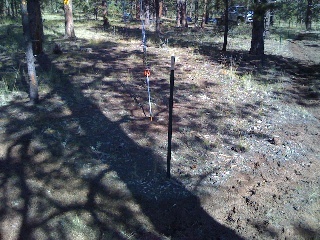
|

|
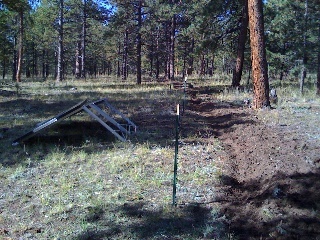
|
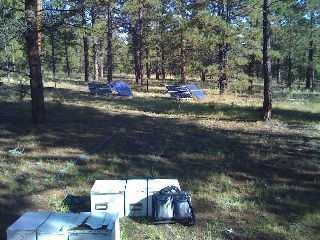
|
|
246°
GPS unit was set to true north.
Used the ACD/BEACHON Magellan GPS from the Chemistry trailer.
Should be confirmed due to potential operator error.
TRH015, installed at 2m on Aug 12 18:51 UTC also reports
incorrect humidities. Its cutoff is around 45%. Above 45%
the reported humidity is anti-correlated with the 4 other
sensors - looking more like a temperature.
In this plot, the night of Aug 11-12 shows the problem with
unit 013, and the next night shows the problem with 015:

replaced 2m TRH sensor at 11:50 MST on August 12
Added by maclean:
Old unit was TRH013, new is TRH015. Here's a data_dump:
2009 08 12 18:51:00.1002 0.839 30 TRH013 28.47 13.81 6804 506\r\n
2009 08 12 18:51:00.9311 0.8308 30 TRH013 28.43 13.73 6800 504\r\n
2009 08 12 18:51:01.7703 0.8392 30 TRH013 28.34 13.59 6791 501\r\n
2009 08 12 18:51:09.4970 7.727 3 \x00\n
2009 08 12 18:51:10.7516 1.255 17 \r Sensor TRH015\n
2009 08 12 18:51:10.7625 0.01084 29 \rcalibration coefficients:\r\n
2009 08 12 18:51:10.8164 0.05398 21 Ta0 = -4.036598E+1\r\n
2009 08 12 18:51:10.8577 0.04124 21 Ta1 = 1.024538E-2\r\n
2009 08 12 18:51:10.9015 0.04383 21 Ta2 = -2.186790E-8\r\n
2009 08 12 18:51:10.9406 0.0391 21 Ha0 = -1.041986E+1\r\n
2009 08 12 18:51:10.9814 0.04083 21 Ha1 = 4.165513E-2\r\n
2009 08 12 18:51:11.0218 0.04031 21 Ha2 = -3.136109E-6\r\n
2009 08 12 18:51:11.0664 0.04469 21 Ha3 = 6.878648E-2\r\n
2009 08 12 18:51:11.1117 0.04531 21 Ha4 = 7.258961E-5\r\n
2009 08 12 18:51:11.4406 0.3289 30 TRH015 29.78 14.38 6950 540\r\n
2009 08 12 18:51:12.2807 0.84 30 TRH015 29.82 14.42 6954 541\r\n
2009 08 12 18:51:13.1207 0.84 30 TRH015 29.88 14.39 6960 540\r\n
2009 08 12 18:51:13.9616 0.841 30 TRH015 29.93 14.39 6965 540\r\n
RH at 2m went walkabout on about Jul 30 02:30 MDT.
After that time it disagrees with the other RH's above ~60%. This looks like what we
saw in ASP09.
This may have happened during a rain event - the sonic diagnostic
flags were high during that time.

The following dump of CSAT sonic parameters is from /var/log/isfs/manitou_BEACHON_SRM_csat3.log
on the data system. It was generated on Jul 17 when the data acquisition process was last started.
These serial numbers agree with Chris' sensor height blog entry.
{{
##################
csat3: manitou:/dev/ttyS1 SN1124 3.0f
time: 2009 07 17 19:42:24
ET= 20 ts=i XD=d GN=212a TK=1 UP=5 FK=0 RN=1 IT=1 DR=102 rx=2 fx=038 BX=0 AH=1 AT=0 RS=1 BR=0 RI=1 GO=00000 HA=0 6X=3 3X=2 PD=2 SD=0 ?d tf=02600 02600 02600
WM=o ar=0 ZZ=0 DC=4 ELo=016 016 016 ELb=016 016 016 TNo=bea d TNb=ad9 JD= 007
C0o=-2-2-2 C0b=-2-2-2 RC=0 tlo=8 8 8 tlb=8 8 8 CA=1 TD= duty=050 AQ= 20 AC=1 CD=0 SR=1 UX=0 MX=0 DTU=02320 ss=1 XP=2 RF=018 DS=007 SN1124 31jul08 JC=3 CB=3 MD=5 DF=05000 RNA=1 sa=1 rev 3.0f cs=17145 &=0 os=
##################
csat3: manitou:/dev/ttyS6 SN1120 3.0f
time: 2009 07 17 19:42:27
ET= 20 ts=i XD=d GN=312a TK=1 UP=5 FK=0 RN=1 IT=1 DR=102 rx=2 fx=038 BX=0 AH=1 AT=0 RS=1 BR=0 RI=1 GO=00000 HA=0 6X=3 3X=2 PD=2 SD=0 ?d tf=02600 02600 02600
WM=o ar=1 ZZ=0 DC=4 ELo=016 016 016 ELb=016 016 016 TNo=bdc d TNb=bcc JD= 007
C0o=-2-2-2 C0b=-2-2-2 RC=0 tlo=8 8 8 tlb=8 8 8 CA=1 TD= duty=046 AQ= 20 AC=1 CD=0 SR=1 UX=0 MX=0 DTU=02320 ss=1 XP=2 RF=018 DS=007 SN1120 05jun08 JC=3 CB=3 MD=5 DF=05000 RNA=1 sa=1 rev 3.0f cs=38395 &=0 os=
##################
csat3: manitou:/dev/ttyS10 SN0673 3.0f
time: 2009 07 17 19:42:31
ET= 20 ts=i XD=d GN=445a TK=1 UP=5 FK=0 RN=1 IT=1 DR=102 rx=2 fx=038 BX=0 AH=1 AT=0 RS=1 BR=0 RI=1 GO=00000 HA=0 6X=3 3X=2 PD=2 SD=0 ?d tf=02600 02600 02600
WM=o ar=0 ZZ=0 DC=4 ELo=015 016 016 ELb=015 016 015 TNo=cda d TNb=ecc JD= 007
C0o=-2-2-2 C0b=-2-2-2 RC=0 tlo=7 8 8 tlb=7 8 7 CA=1 TD= duty=050 AQ= 20 AC=1 CD=0 SR=1 UX=0 MX=0 DTU=02320 ss=1 XP=2 RF=018 DS=007 SN0673 13nov07 JC=3 CB=3 MD=5 DF=05000 RNA=1 sa=1 rev 3.0f cs=59504 &=0 os=
##################
csat3: manitou:/dev/ttyS15 SN0672 3.0f
time: 2009 07 17 19:42:35
ET= 20 ts=i XD=d GN=535a TK=1 UP=5 FK=0 RN=1 IT=1 DR=102 rx=2 fx=038 BX=0 AH=1 AT=0 RS=1 BR=0 RI=1 GO=00000 HA=0 6X=3 3X=2 PD=2 SD=0 ?d tf=02600 02600 02600
WM=o ar=0 ZZ=0 DC=4 ELo=015 016 015 ELb=015 016 015 TNo=8bb d TNb=abb JD= 007
C0o=-2-2-2 C0b=-2-2-2 RC=0 tlo=7 8 7 tlb=7 8 7 CA=1 TD= duty=049 AQ= 20 AC=1 CD=0 SR=1 UX=0 MX=0 DTU=02320 ss=1 XP=2 RF=018 DS=007 SN0672 14nov07 JC=3 CB=3 MD=5 DF=05000 RNA=1 sa=1 rev 3.0f cs=62873 &=0 os=
##################
csat3: manitou:/dev/ttyS16 SN0677 3.0f
time: 2009 07 17 19:42:39
ET= 20 ts=i XD=d GN=443a TK=1 UP=5 FK=0 RN=1 IT=1 DR=102 rx=2 fx=038 BX=0 AH=1 AT=0 RS=1 BR=0 RI=1 GO=00000 HA=0 6X=3 3X=2 PD=2 SD=0 ?d tf=02600 02600 02600
WM=o ar=0 ZZ=0 DC=4 ELo=016 016 016 ELb=016 016 016 TNo=99b d TNb=a9a JD= 007
C0o=-2-2-2 C0b=-2-2-2 RC=0 tlo=8 8 8 tlb=8 8 8 CA=1 TD= duty=050 AQ= 20 AC=1 CD=0 SR=1 UX=0 MX=0 DTU=02320 ss=1 XP=2 RF=018 DS=007 SN0677 30oct07 JC=3 CB=3 MD=5 DF=05000 RNA=1 sa=1 rev 3.0f cs=06092 &=0 os=
##################
}}
BEACHON Heights and Sensors
*Note: The heights were from top of boom to top of plate.
42.86m CSAT 0677
TRH
29.90m CSAT 0672
TRH
16.06m CSAT 0673
TRH
7.42m CSAT 1120
TRH
2.04m CSAT 1124
TRH
BEACHON Tower Guy-Wire Tensions (lbs).....THIS SHOULD BE AN ON-GOING LOG
Inner to Outer...
South Guy-Wire:
Guy-Wire |
7/7/09 Sharon |
7/17/09 Ned |
8/28/09 Ned |
10/01/09 |
02/02/10 |
05/28/10 |
7/22/10 |
3/29/11 |
7/31/11 |
10/14/11 |
8/15/2012 |
|---|---|---|---|---|---|---|---|---|---|---|---|
Inner (Close to tower) |
500 (425) |
425 |
350 |
375 |
350 |
250 |
385 |
380 |
300 |
320 |
275 |
|
550 (510) |
460 |
405 |
450 |
415 |
340 |
385 |
375 |
340 |
340 |
310 |
|
500 (420) |
380 |
355 |
350 |
350 |
300 |
395 |
365 |
325 |
330 |
320 |
|
500 (500) |
460 |
415 |
450 |
430 |
350 |
375 |
390 |
325 |
350 |
300 |
|
500 (400) |
370 |
330 |
325 |
320 |
275 |
440 |
400 |
350 |
380 |
345 |
Outer (Farthest) |
450 (400) |
350 |
330 |
350 |
340 |
290 |
390 |
350 |
335 |
340 |
300 |
Northwest Guy-Wire:
Guy-Wire |
7/7/09 Sharon |
7/17/09 Ned |
8/28/09 Ned |
10/01/09 |
02/02/10 |
05/28/10 |
7/22/10 |
3/29/11 |
7/31/2011 |
10/14/11 |
8/15/2012 |
|---|---|---|---|---|---|---|---|---|---|---|---|
Inner (Close to tower) |
600 (490) |
450 |
375 |
380 |
360 |
300 |
450 |
440 |
350 |
390 |
330 |
|
550 (500) |
450 |
405 |
440 |
400 |
325 |
395 |
390 |
325 |
350 |
300 |
|
450 (500) |
470 |
445 |
450 |
450 |
390 |
475 |
440 |
425 |
430 |
400 |
|
600 (500) |
450 |
400 |
425 |
400 |
340 |
380 |
390 |
325 |
350 |
300 |
|
440 (415) |
410 |
355 |
375 |
355 |
300 |
425 |
390 |
350 |
370 |
320 |
Outer (Farthest) |
430 (400) |
360 |
345 |
350 |
340 |
300 |
400 |
390 |
350 |
360 |
330 |
Northeast Guy-Wire (nearest to the road)
Guy-Wire |
7/7/09 Sharon |
7/17/09 Ned |
8/28/09 Ned |
10/01/09 |
02/02/10 |
05/28/10 |
7/22/10 |
3/29/11 |
7/29/11 |
10/14/11 |
8/15/2012 |
|---|---|---|---|---|---|---|---|---|---|---|---|
Inner (Close to tower) |
580 (470) |
440 |
360 |
400 |
395 |
300 |
420 |
410 |
340 |
355.5 |
340 |
|
600 (550) |
500 |
425 |
450 |
440 |
350 |
450 |
450 |
370 |
400 |
360 |
|
680 (670) |
590 |
575 |
625 |
610 |
525 |
500 |
550 |
500 |
550 |
520 |
|
500 (460) |
450 |
375 |
375 |
380 |
300 |
425 |
400 |
340 |
360 |
340 |
|
600 (525) |
500 |
425 |
440 |
405 |
325 |
475 |
425 |
400 |
410 |
400 |
Outer (Farthest) |
480 (405) |
410 |
360 |
400 |
370 |
330 |
450 |
400 |
400 |
400 |
400 |
Modifications:
090717, jwm Added readings by Ned Patton on 7/17/09. Note roughly 100-lb drop on each, but there was no shift on the anchors/base per-paint applied; ie stretching.
090828, egp Anchors did not exhibit any shifting, added new readings to the tables above.
091001, csg Anchors looked good. Tensions were fine. May need some tensioning on South guy-wires soon.
100528, egp Anchors looked good, not shifting. Kurt recommends re-tensioning guy wires complete with transits to re-plumb tower. July 2010?
7/22/10 re-tensioned all guy wires using transits to plumb tower, also replaced 7m & 15m trh cables as well as 7m trh sensor.
111014, csg Check tensions. All looked great!
8/15/2012: csg Tower looking a little odd up top. Ned did notice the tower was a little wabbly towards the top. Tower should be re-tensioned this year.
Jul 17, 2009
Installed AP24, 802.11 access point on walkup tower, just above the 11th section. Ethernet IP: 192.168.100.202, Wireless IP: 192.168.12.251.
Borrowed 100 ft white cat 5 cable in server seatainer for the run from the network switch in the seatainer up the tower.
Installed a Patton Model 570 ethernet surge protector in the seatainer. I believe it was installed
between the white cable coming from the tower and the AP24 power injector. The other possibility is
that it was installed between the AP24 power injector and the network switch. It was grounded
to a cover plate screw on a power outlet.
Installed etherant on turbulence tower, 192.168.12.35. It is connected to the eth1 port on the front of the adam.
Installed a 4 port linksys switch in the adam.
Viper CPU in ADAM has address 192.168.12.167.
Set up ssh port forwarding so that Viper is addressable from 192.168.100 net without a routing table entry.
Installed a Patton 570 surge protector inside the adam at the flux tower, grounded to the chassis,
between the inside RJ45 connector of the ethernet port on the interface panel and the 4 port switch in the box.