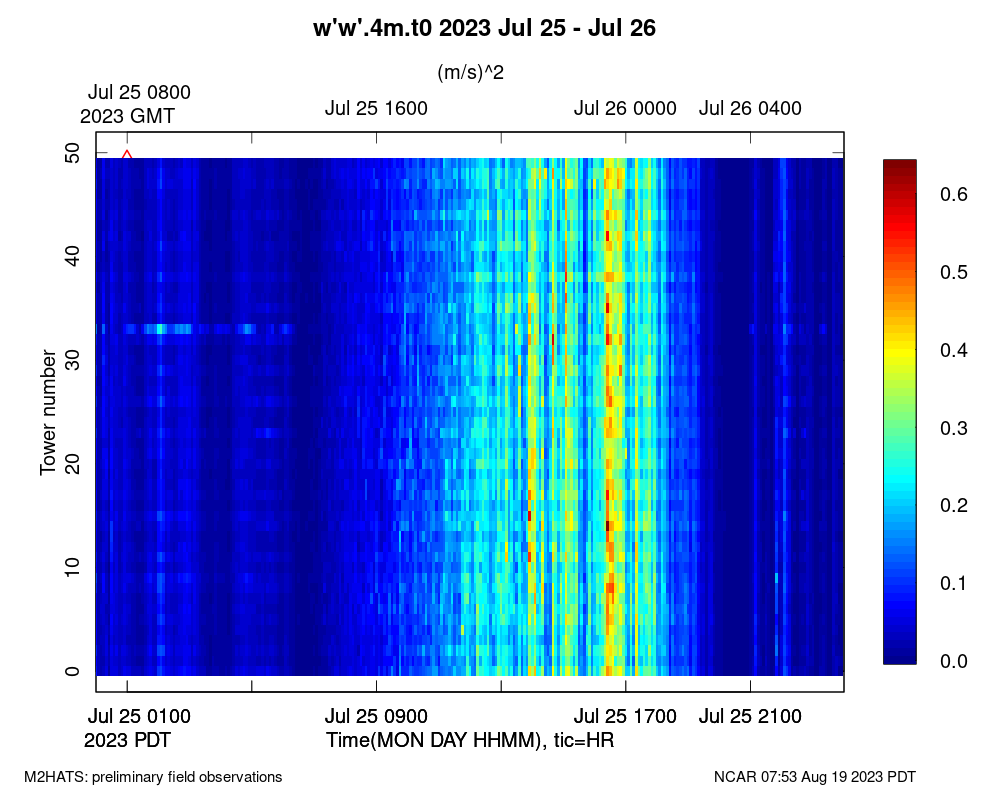
Yet another slightly worrying artifact in the data is the turbulence across the horizontal array. In the web plot here (a new type of plot I created for this project), I see streaks where every third(?) sonic has slightly higher vertical velocity variance than its neighbors. I actually designed the deployment array so that we could check that this type of artifact hopefully didn't exist. The conclusion would be that one of the types of CSAT sonic reads higher vertical velocities than another. This could be in part related to the sample rate, since the CSAT3A and 3Bs are running at higher rates that the CSAT3s and thus might see a bit more velocity variance contributed by high frequencies. It is also possible that something more subtle is going on. We should probably start running some power spectra from adjacent sonics.